
Figures & data
Figure 1 Distribution of patients by age (A), by Glomerular Filtration Rate (B), and by duration of treatment (C) with tapentadol vs oxycodone/naloxone.
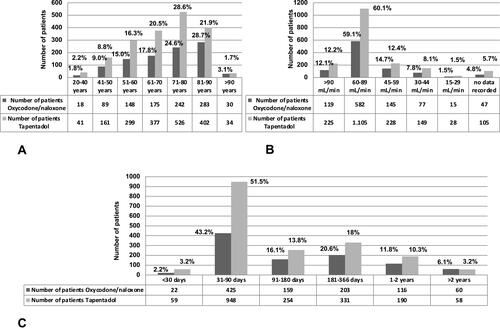
Figure 2 Average daily dose according to age groups (A), to sex (B), and to duration of treatment (C).
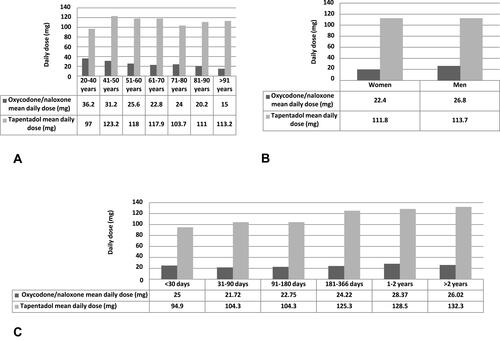
Figure 3 Distribution of drug treatment combination and number of patients.
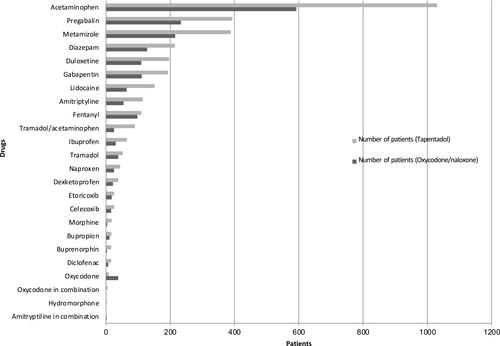
Table 1 Distribution of Patients Taking Tapentadol and Oxycodone/Naloxone and Their Diagnoses
Table 2 Other Diagnoses Associated with Tapentadol Prescription
Table 3 Other Diagnoses Associated with Oxycodone/Naloxone Prescription