
Figures & data
Figure 1 The flow diagram of data sampling.
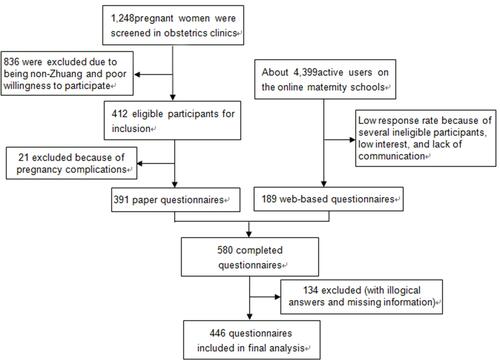
Table 1 Participants’ Demographic and Obstetric Characteristics, Adaptations in Behavior, and Differences in the Self-Rating Anxiety Scale (SAS) Scores (N = 446)
Table 2 Multivariate Logistic Regression Analysis of Participants’ Anxiety (N = 446)