
Figures & data
Figure 1 Population density (A), road network (B) and distribution of network hospitals (C) in Chengdu, 2017.
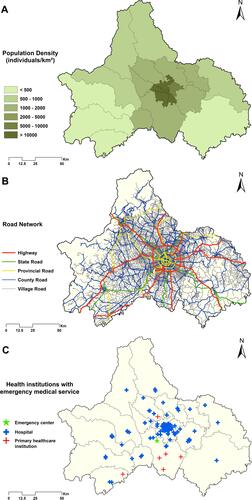
Table 1 Parameter Settings in GA
Table 2 Access to EMS Before and After Facility Upgrading
Figure 2 Access (shortest travel time) to network hospitals before (A) and after facility upgrading (B).
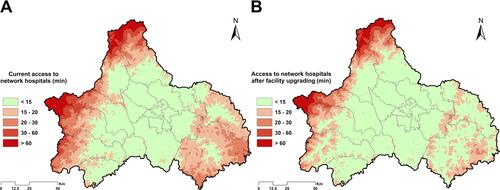
Figure 3 Distribution of current and newly upgraded network hospitals in Chengdu. Numbers denoted the upgrading order of each facility.
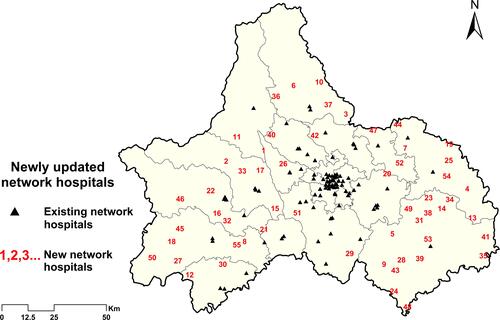
Table 3 Summary Results of Three Sensitivity Analyses