Figures & data
Table 1 Differences Between Demographic and Clinical Characteristics of T2DM and Non-T2DM Groups
Figure 1 Using the LASSO model of logistic regression to determine the connection between populations and clinical characteristics.
Notes: (A) In the Lasso Regression model, the best parameter is selected using the criterion of thirteen cross-validations. The curves of partial probability variance and the curve of logarithm are illustrated. To obtain the best estimate, use a 1-SE procedure with the minimum standard and minimum standard. (B) LASSO linear discriminant regression coefficients for the 12 characteristics. The profile is determined according to the logarithm of lambda. A cross-validation technique is used to test the optimal lambda, where the optimal lambda produces eight coefficients.
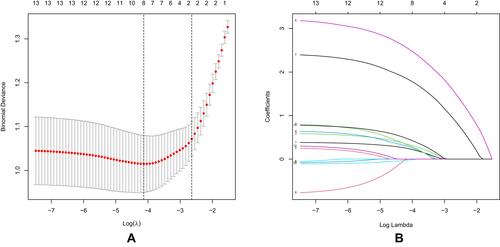
Table 2 Prediction Factors for HZ in T2DM Patients
Figure 2 Development of the HZ nomogram. The chart is made from the data based on gender, age, length of hospital stay, weight, 2 hour PG, creatinine, location of skin rash, and hypertension.
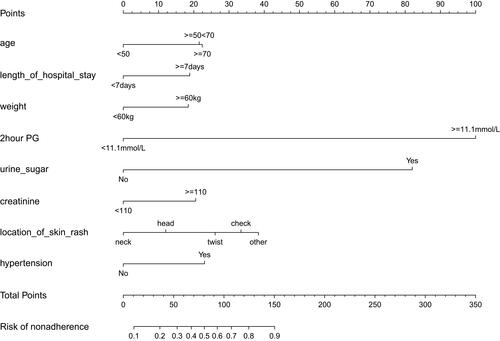
Figure 3 The calibration curves of the topic HZ nomogram prediction in the cohort.
Notes: The x-axis indicates the estimated potential for hyperhidrosis. The x-axis reflects the diagnoses of High-Z-Diagnosis. A perfect prediction model describes a perfect forecast. The graph demonstrates the fit of a nomogram for the prediction of results, of which a tighter fit to the dotted line represents a more robust prediction.
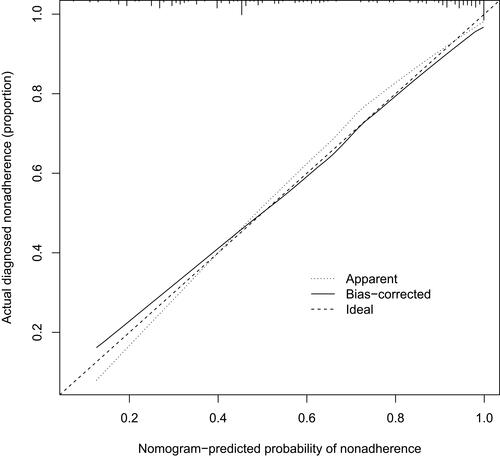
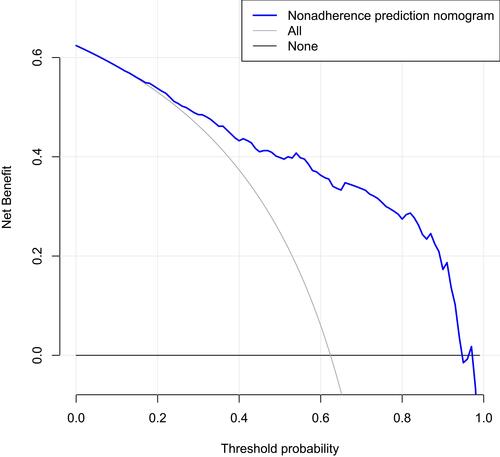
Figure 4 Decision curve analysis (DCA) for the HZ nomogram.
Notes: The y-axis is an indicator of profitability. This table depicts the hazardous zone rating by threat category. The thin solid line is the presumption for all HZ being handled. The small, thick solid line reflects the presumption that the amount of non-diabetes patients in the sample is adequate. The decision curve indicated that the chance a patient and a specialist would enter the plan if the possibility rate is 16% and 76%, respectively.