Figures & data
Table 1 Demographic Characteristics of the Respondents (N = 1970) by Sub-Saharan African Sub Region. Values are Number (Percentages) Except for Age
Figure 1 Percentage distribution of any impact of COVID-19 during the lockdown in the sub-Saharan African regions by age group (n = 1970).
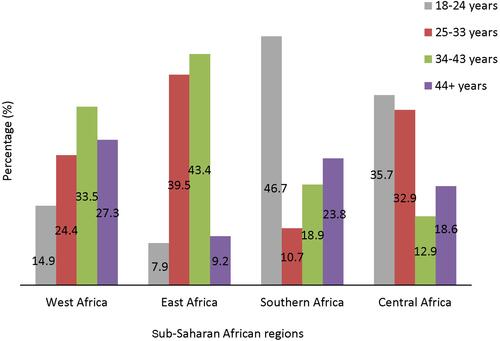
Figure 2 Percentage breakdown of the impacts of COVID-19 (lost jobs, closed down businesses, contracted COVID-19, hospitalized due to COVID-19 and physical separation from families) during the lockdown in the sub-Saharan African regions by gender: West Africa (A), East Africa (B), Southern Africa (C) and Central African (D) regions (n=1970). *Indicates a significant difference in the impact of COVID-19 between men and women (p < 0.05, independent t-test).
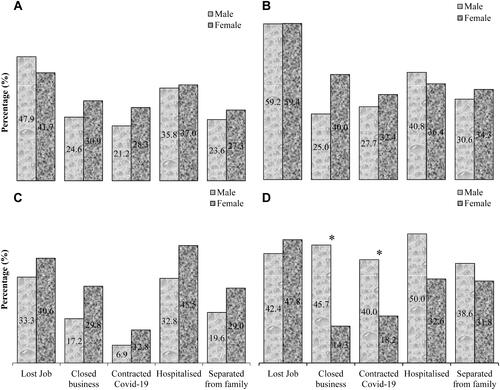
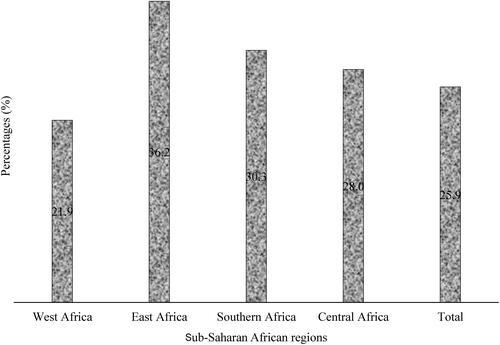
Figure 3 Percentage distribution of any impact of COVID-19 by sub-Saharan African sub-region (n = 1970).