Figures & data
Table 1 Statistical Descriptions of Meteorological Parameters and Air Pollutants Between December 30, 2013, and December 31, 2019, in Chengdu
Figure 1 Spearman correlation analysis of meteorological parameters and air pollutants. The correlation coefficient of two variables marked as “×” is greater than 0.9.
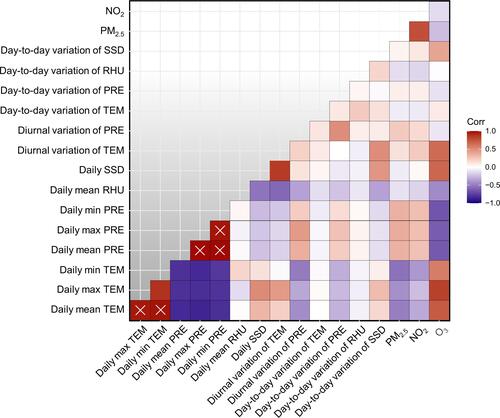
Figure 2 The forest diagram shows the effect of daily meteorological parameters on intracerebral hemorrhage (ICH) occurrence risk in the single-factor model. The red line represents daily meteorological parameters, and the blue line represents meteorological parameters fluctuation. (A) Odds ratios of ICH onset risk in all study months. (B) Odds ratios of ICH onset risk in cold months. (C) Odds ratios of ICH onset risk in warm months. *P<0.05; **P<0.01.
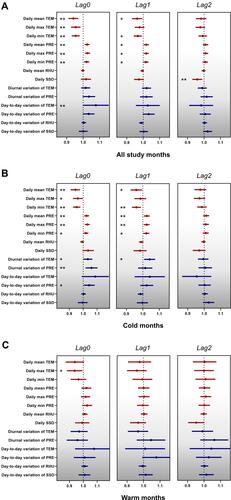
Table 2 The Effect of Daily Meteorological Parameters on the ICH Onset Risk for All Study Months in the Two-Factor Model (or, 95% CI)
Table 3 The Effect of Day-to-Day Variation of Meteorological Parameters on the ICH Onset Risk for All Study Cases in the Two-Factor Model (or, 95% CI)
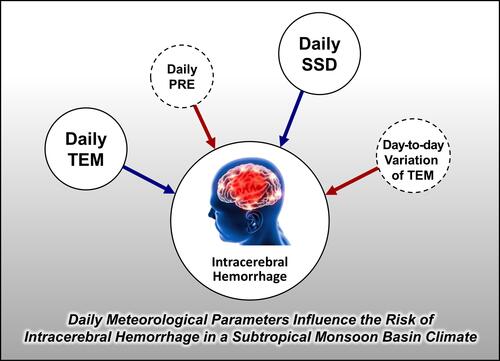
Figure 3 Summary of the relationship between daily meteorological parameters and intracerebral hemorrhage (ICH) onset risk in a subtropical monsoon basin climate. The blue solid line indicates that the parameter negatively correlated with the ICH occurrence, and the red solid line represents a positive correlation between the parameter and ICH onset. The black solid circle means the parameter is an independent risk factor, and the black dotted circle shows the parameter is a non-independent risk factor.