Figures & data
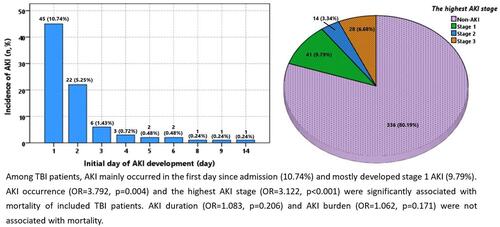
Figure 1 Flowchart of patient inclusion.
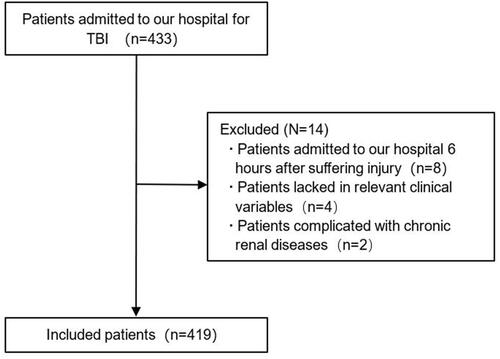
Table 1 Baseline characteristics of TBI patients with and without AKI
Figure 2 (A) Initial day of AKI development during hospitalization in TBI patients. This was principally on the first day (10.74%). (B) Distribution of AKI duration during hospitalization in TBI patients, most commonly 1 day (10%). (C) Distribution of highest AKI stage during hospitalization in TBI patients. Stage 1, 2, and 3 AKI incidence was 9.79%, 3.34%, and 6.68%, respectively. (D) Distribution of AKI burden during hospitalization in TBI patients, most commonly stage 1 (7.2%).
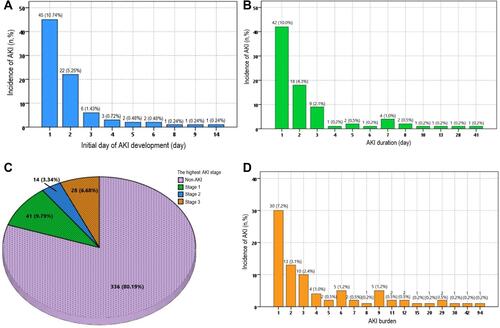
Table 2 Univariate logistic regression analysis for risk factors of mortality in TBI patients
Table 3 Characteristics of AKI-related variables and their association with mortality on univariate and multivariate logistic regression analysis
Figure 3 (A) Mortality comparison of TBI patients grouped by AKI occurrence. (B) Mortality comparison of included TBI grouped by AKI duration. Bonferroni corrected α was 0.05/3 (p=0.0167). (C) Mortality comparison of TBI patients grouped by the highest AKI stage. Bonferroni corrected α was 0.05/6 (p=0.0083). (D) Mortality comparison of TBI patients grouped by AKI burden. Bonferroni corrected α was 0.05/3 (p=0.0167).
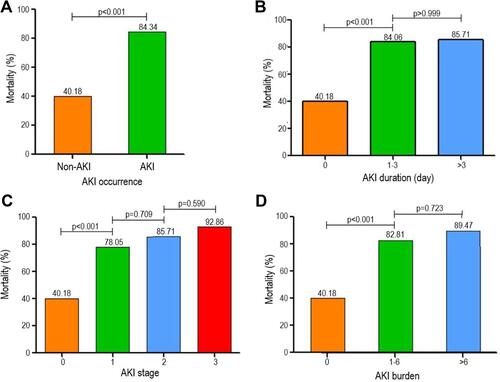
Table 4 Predictive value of single lactate and the logistic model
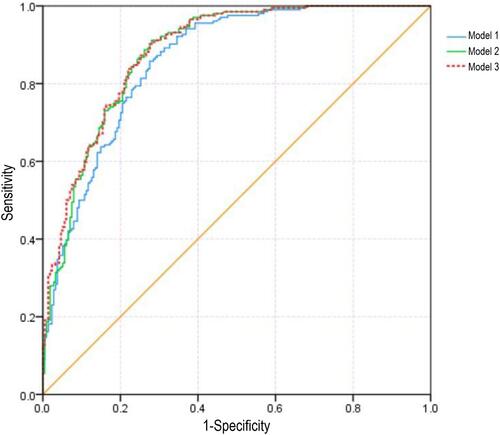
Figure 4 Receiver-operating characteristic curve of multivariate logistic models incorporating AKI-related variables for predicting mortality of TBI patients. Model 1 was composed of GCS, glucose, and SDH, with AUC of 0.860. Model 2 was composed of GCS, glucose, SDH, and AKI, with AUC of 0.880. Model 3 was composed of GCS, glucose, SDH, and highest AKI stage, with AUC of 0.885.