
Figures & data
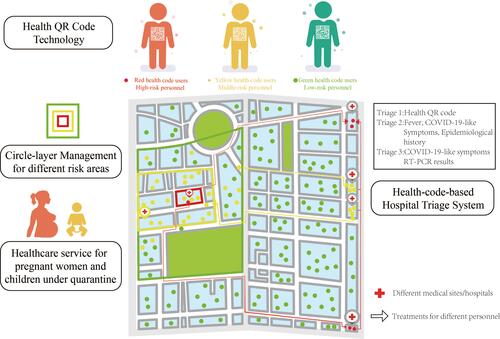
Figure 1 The schematic diagram of Chengdu’s COVID-19 confinement arrangement (circle-layer policy) during the summer outbreak.
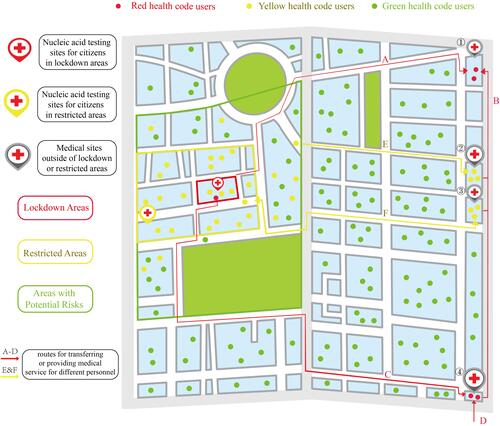
Figure 2 The flowchart of the health-code-based triage system.
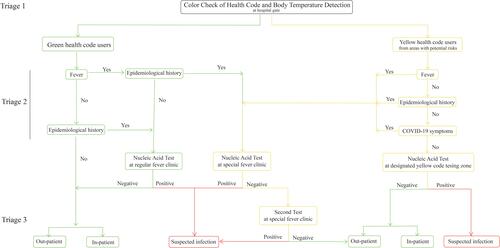
Figure 3 The dynamic change in the number of different personnel under Chengdu’s circle-layer management during the summer outbreak of COVID-19. (A) The dynamic change in the number of different personnel with red health codes. (B) The dynamic change in the number of quarantined pregnant women. (C) The dynamic change in the number of children below 6 years old.
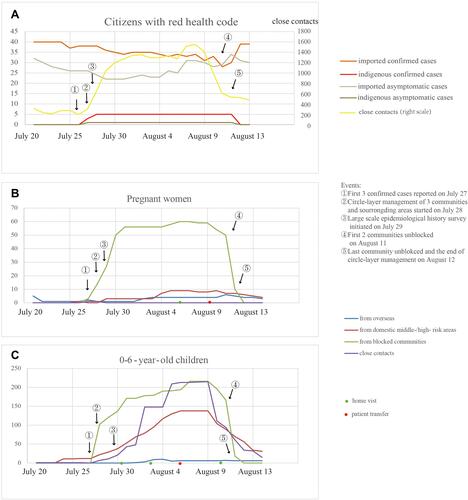
Table 1 The Comparison of COVID-19 Correlated Features in Patients with Green and Yellow Health Code from Regular and Special Fever Clinic in Chengdu Women’s and Children’s Central Hospital During the Circle-Layer Management