
Figures & data
Table 1 Characteristics of Older Adult Patients
Figure 1 Most frequent pharmacological subgroups (third level), according to the ATC classification system of prescribed.
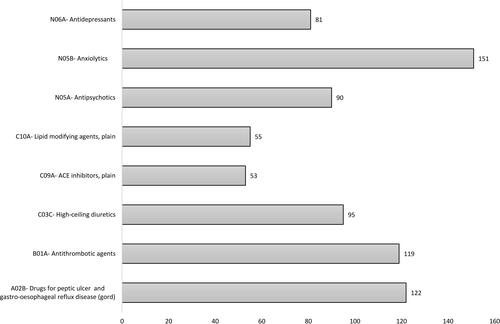
Table 2 Most Frequent PIM According to the EU (7)-PIM List
Figure 2 Directed acyclic graphs. Proposed relationship between the different variables (A) and the relationship between the different variables after the appropriate adjustment (B).
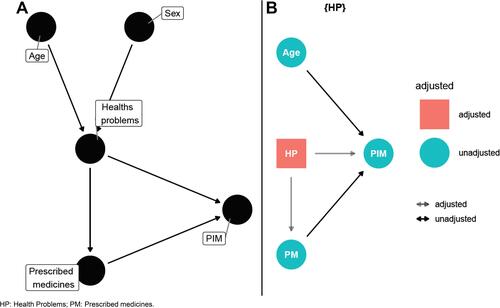
Table 3 Factors Influencing the Presence of PIM