Figures & data
Figure 1 PRISMA 2020 flow diagram of outputs obtained in step 2.
Notes: PRISMA figure adapted from Page MJ, McKenzie JE, Bossuyt PM et al. The PRISMA 2020 statement: an updated guideline for reporting systematic reviews. BMJ. 2021;372:n71. Creative Commons.Citation22 *Results excluded following screening (reasons): 1) Focused on processes and their relation to regulation (influence of non-financial, non-medical variables). 2) Focused on regulation as such; methods for evaluating regulation are lacking. 3) Economic circumstances described only very superficially (eg financial data are missing); focused on the medical aspect. Necessary economic context in the form of costs, benefits, and financial impact as well as methods for an economic evaluation of the research problem are missing (missing numbers, data, methods). Regarding the work with articles classified as review, such articles were included, provided that the area of review concerned a medical problem, ie, the economic issue was not the primary topic but economic issues were desirably represented in the review.
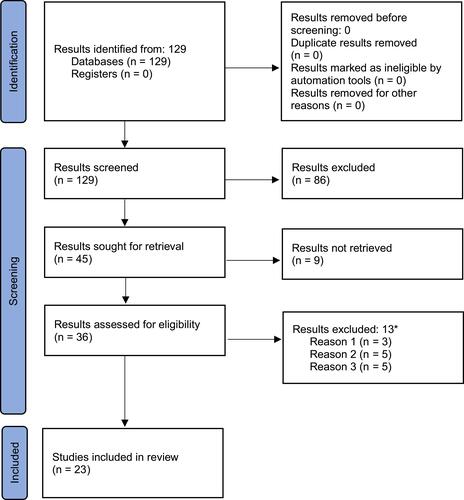
Figure 2 Number of publications according to the filter from step 1 for the last 20 years.
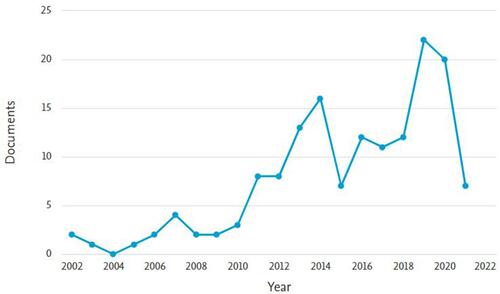
Figure 3 Cluster analysis of keywords in step 1 (all, regulation, cost-effectiveness analysis, economy).
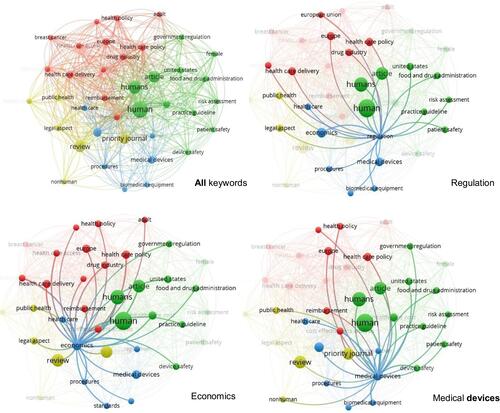
Table 1 Clusters of Keywords in WoS
Table 2 Step 2 – Medical Device, Regulation, and Innovation – Economic Context
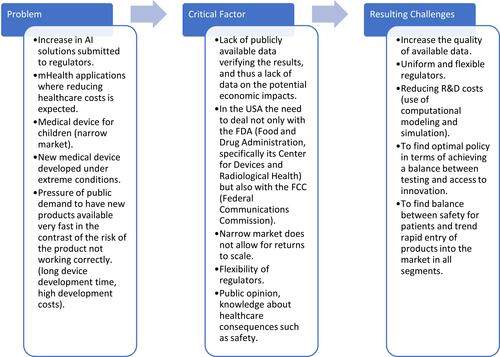
Figure 4 Basic economic variables and frequently used methods of economic impact assessment – key stakeholders.
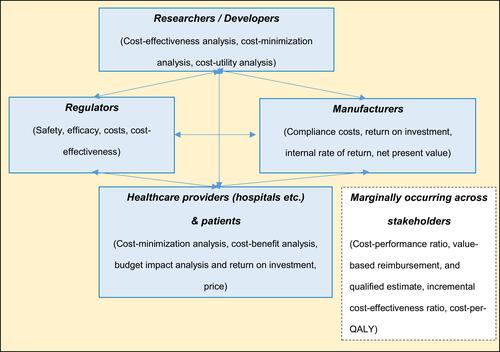
Figure 5 Critical moments and processes.