
Figures & data
Table 1 Comparison of General Data Between the Two Groups[n (%)]
Table 2 Comparison of ECG Results Between the Two Groups[n (%)]
Table 3 Comparison of NC, LC, PLT, NLR and PLR in Peripheral Blood Between the Two Groups ()
Figure 1 The receiver operating curve for the diagnosis of cardiac syndrome X by each indicator.
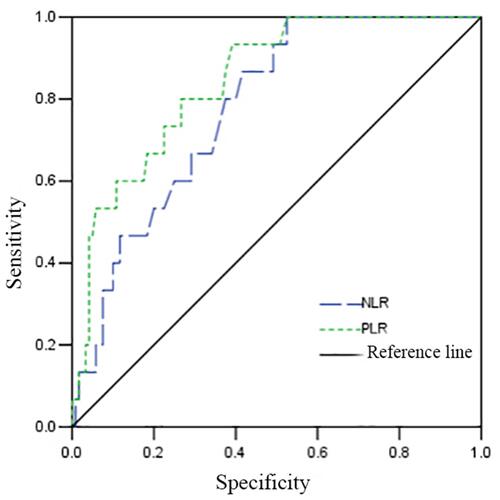
Table 4 Multivariate Logistic Regression Analysis of CSX Influencing Factors