Figures & data
Figure 1 A flow chart for screening the study subjects was established.
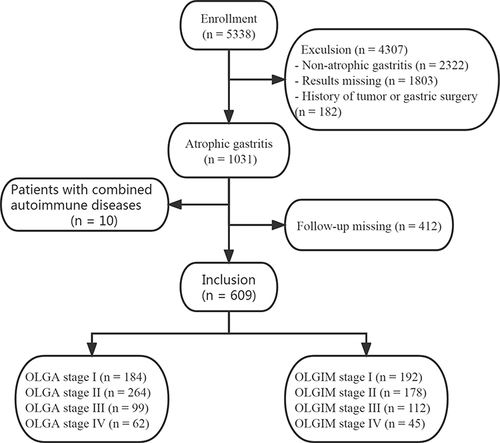
Table 1 Baseline Characteristics of Patients with Atrophic Gastritis in This Study
Table 2 Serum PGs/G-17 Levels and Population Characteristics in OLGA/OLGIM Stage
Table 3 Serum PGs/G-17 in OLGA/OLGIM Stages I–II and III–IV
Table 4 Univariate Logistic Regression Analysis of Risk Factors for Patients with OLGA/OLGIM III–IV
Table 5 Multivariate Logistic Regression Analysis of Risk Factors for Patients with OLGA/OLGIM III–IV
Table 6 Characteristics of Eight Patients with GC
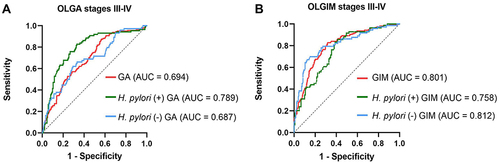
Figure 2 (A) ROC curves of PGI for the diagnosis of OLGA stages III–IV of atrophic gastritis (the green line is patients with H. pylori-positive; the blue line is patients with H. pylori-negative; the red line is all patients with GA). (B) ROC curves of PGR for the diagnosis of OLGIM stages III–IV of atrophic gastritis (the green line is patients with H. pylori-positive; the blue line is patients with H. pylori-negative; the red line is all patients with GIM).