153
Views
0
CrossRef citations to date
0
Altmetric
ORIGINAL RESEARCH

Management of SARS-CoV-2 Omicron Variant Community Screenings in Shanghai, China: A Cross-Sectional Study

ORCID Icon, , , , , , & show all
Pages 111-120 | Received 17 Oct 2022, Accepted 11 Jan 2023, Published online: 02 Feb 2023

Figures & data

Table 1 Characteristics of 203 Residential Committee Directors

Table 2 Infection Prevention and Control Management Patterns During the SARS-CoV-2 Omicron Variant Pandemic: Results from 203 Valid Questionnaires

Figure 1 The common layouts of community NAT sites.

Notes: (A) There is only one sampling table and medical worker at a single sampling site. (B) There is only one sampling table at a single sampling site, with multiple medical workers taking samples and residents not facing each other at the time of sampling. (C) There are multiple sampling tables at a single sampling site, with multiple medical workers taking samples. The distance between sampling tables is more than 1.5m, and the residents are not face to face during sampling. (D) There are multiple sampling tables at a single sampling site, with multiple medical workers taking samples. The distance between sampling tables is less than 1.5m, and residents are not face to face during sampling. (E) There is only one sampling table at a single sampling site, with multiple medical workers taking samples and residents facing each other at the time of sampling. (F) There are multiple sampling tables at a single sampling site, with multiple medical workers taking samples and residents sitting back to back during sampling.
Figure 1 The common layouts of community NAT sites.

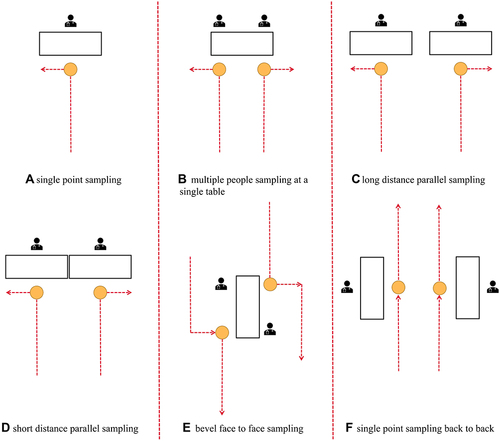
Table 3 Comparison of Number of Tables per Sampling Site

Table 4 Comparison of Low-Risk and High-Risk Groups in One-Table Sampling Sites

Table 5 Comparison of Low-Risk and High-Risk Groups in Sampling Sites with Two Tables Spaced 1.5m Apart

Table 6 Comparisons Among Communities of Different Sizes

Table 7 Comparison of Low-Risk and High-Risk Groups in Communities with Less Than 1000 Residents

Table 8 Comparison of Low-Risk and High-Risk Groups in Communities with 1000~3000 Residents

Table 9 Comparison of Low-Risk and High-Risk Groups in Communities with More Than 3000 Residents