Figures & data
Table 1 The DALYs and Deaths of COPD in China Attributable to Ambient PM2.5 Exposure in 1990 and 2019, and Its Estimated Annual Percentage Change from 1990 to 2019
Figure 1 The trends in the age-standardized mortality rate (ASMR) of chronic obstructive pulmonary disease attributable to ambient PM2.5 exposure from 1990 to 2019 in China.
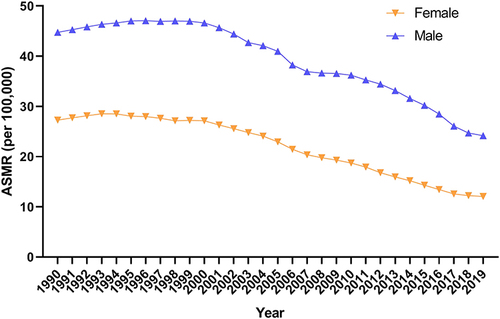
Figure 2 The trends in the age-standardized DALYs rate (ASDR) of chronic obstructive pulmonary disease attributable to ambient PM2.5 exposure from 1990 to 2019 in China.
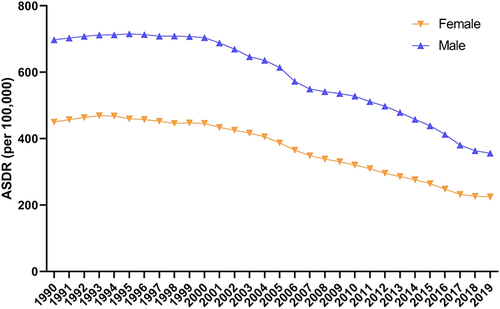
Table 2 Age–Period–Cohort (APC) Model Analysis Results of COPD Mortality Attributable to Ambient PM2.5 Exposure in China Female, P < 0.05
Table 3 Age–Period–Cohort (APC) Model Analysis Results of COPD Mortality Attributable to Ambient PM2.5 Exposure in China Male, P < 0.05
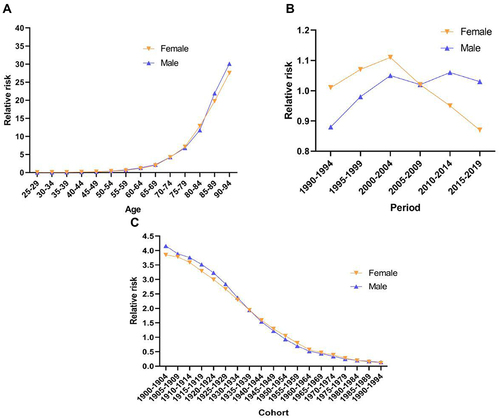
Figure 3 Chronic obstructive pulmonary disease mortality in China attributable to ambient PM2.5 exposure relative risks due to (A) Age; (B) Period; and (C) Cohort.