Figures & data
Table 1 Baseline Characteristics of the Investigated Patients (n = 403)
Table 2 Univariate and Multivariate Logistic Regression Analysis of Clinical Candidate Predictors
Figure 1 Clinical nomogram predicting the re-RD probability in patients with RRD. Interpretation: The nomogram represents the regression equation visually. It develops scoring criteria based on the magnitude of the regression coefficients of all independent variables in the model. Determine the value of the variable on the corresponding axis, draw a vertical line to the total points axis to determine the points, add the points of each variable, and draw a line from the total point axis to determine the re-RD probabilities at the lower line of the nomogram.
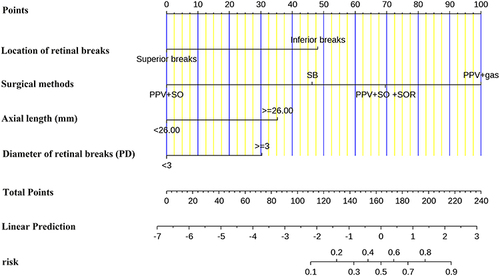
Figure 2 Receiver operating characteristic curve.
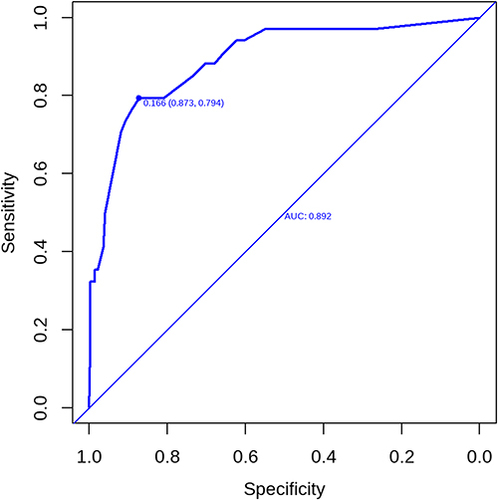
Figure 3 Internal validation of the nomogram using bootstrap sampling. The ROC curve was measured by bootstrapping for 500 repetitions, and the AUC of the bootstrap stepwise model was shown.
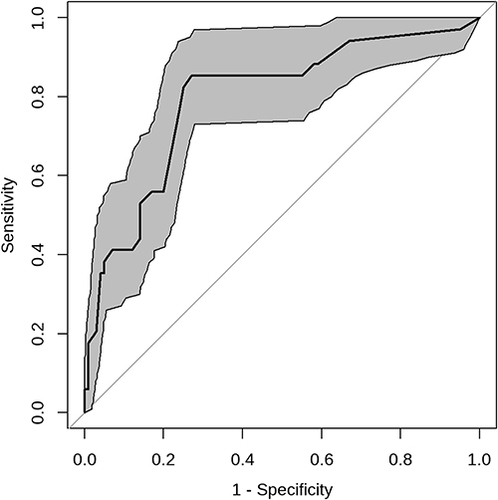
Figure 4 Internal validation of the nomogram using bootstrap sampling. A calibration curve was measured by bootstrapping for 500 repetitions. The X axis is the predicted probability of the nomogram, and the Y axis is the observed probability. The red line shows the ideal calibration line, while the yellow area shows the 95% confidence interval of the prediction model.
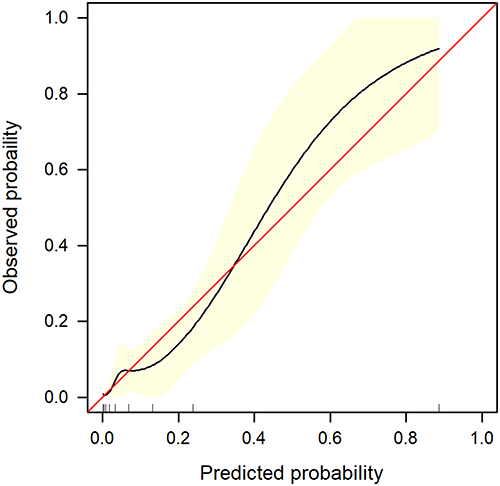
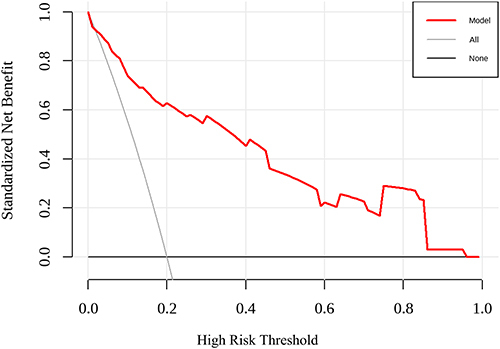
Figure 5 Decision curve analyses depict the prediction nomogram’s clinical net benefit. The graph indicates the expected net benefit per patient relative to the nomogram prediction of re-RD. Red solid line: a prediction model. Tin slash line: Assume all patients have re-RD. Solid horizontal line: Assume no patients have re-RD.