Figures & data
Table 1 Demographic Factors of Newly Developed ITP Patients
Figure 1 Incidence of ITP by age group. The bars indicate the incidence of newly diagnosed ITP each year. The line represents the mean annual ITP incidence from 2015 to 2019.
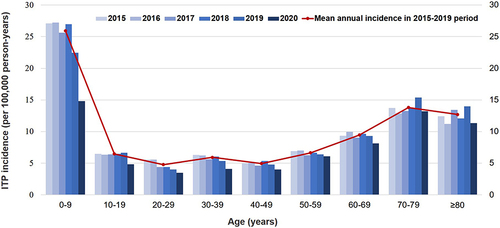
Figure 2 Monthly incidence of ITP by age group. The lines represent the ITP incidence in each age group. The bars indicate the number of newly diagnosed COVID-19 cases. The shadowed field represents the NPI period.
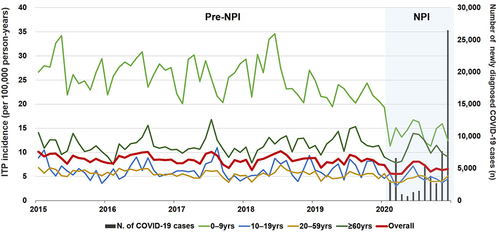
Figure 3 Comparison of the incidence of ITP in the pre-NPI and NPI periods during the same months. The triangle indicates the incidence rate ratio (IRR) of ITP incidence with the overall age groups between the pre-NPI and NPI periods. The squares indicate the incidence rate ratio of ITP in each age group. The circles indicate the incidence rate ratio of ITP in each age group under ten years of age. IRR and 95% confidence intervals are represented with a forest-plot. The gray vertical line represents the IRR of 1.0.
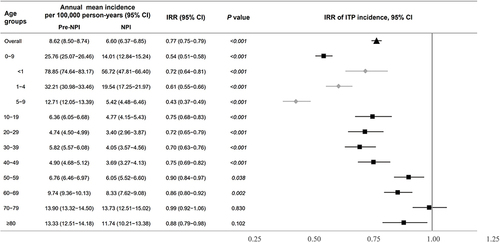
Figure 4 Comparison of the incidence of IVIG-treated ITP in the pre-NPI and NPI periods during the same months. The triangle indicates the incidence rate ratio (IRR) of IVIG-treated ITP incidence with the overall age groups between the pre-NPI and NPI periods. The squares indicate the relative ratio of ITP incidence in each age group. The circles indicate the relative ratio of ITP incidence in each age group under ten years of age. IRR and 95% confidence intervals are represented with a forest-plot. The gray vertical line represents the IRR of 1.0.
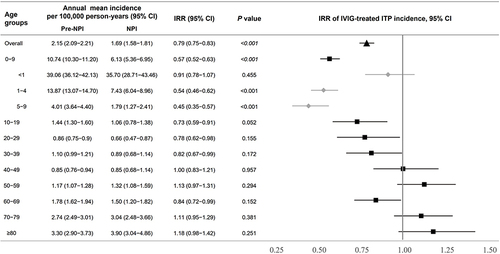
Figure 5 Comparison of the incidence of steroid-treated ITP in the pre-NPI and NPI periods during the same months. The triangle indicates the incidence rate ratio (IRR) of steroid-treated ITP incidence with the overall age groups between the pre-NPI and NPI periods. The squares indicate the relative ratio of ITP incidence in each age group. The circles indicate the relative ratio of ITP incidence in each age group under ten years of age. IRR and 95% confidence intervals are represented with a forest plot. The gray vertical line represents the IRR of 1.0.
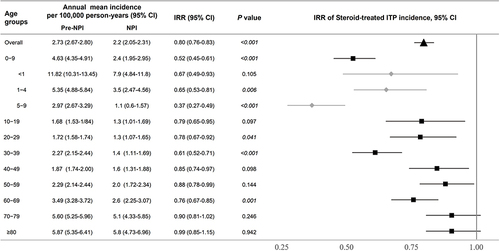
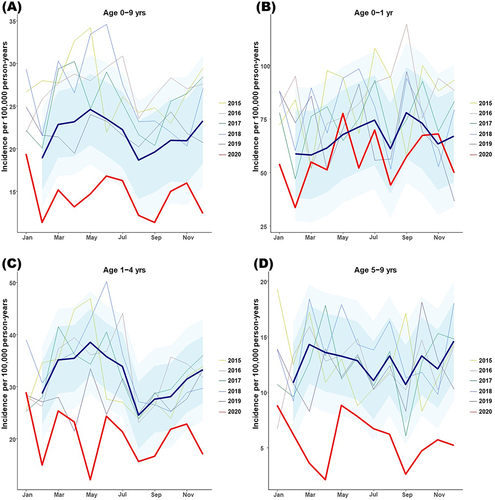
Figure 6 Observed ITP incidence and predicted ITP incidence by the ARIMA model. The monthly incidence of ITP and incidence predicted by an autoregressive integrated moving average model. The thick red line denotes the observed incidence during the NPI period, the thick blue line indicates the predicted incidence in the NPI period, and the blue shades represent 80% and 95% Cis of the predicted incidence in the NPI period. (A) Age group of 0–9 years, (B) age group of 0–1 year, (C) age group of 1–4 years, and (D) age group of 5–9 years.