Figures & data
Table 1 Top ten Pharmaceutical Companies by Revenues in 2020
Figure 1 Evolution of the NYSE Composite and company share prices and the NYSE Composite, June 6, 2019- December 31, 2021.
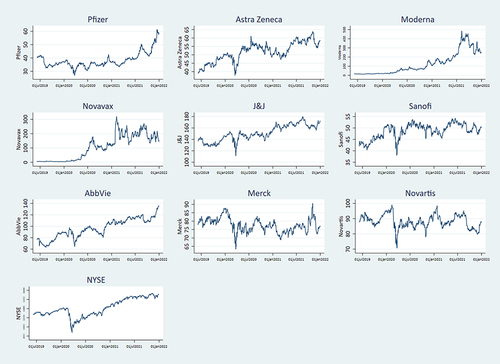
Table 2 Descriptive Statistics, Company Returns
Table 3 PairwiseCorrelations, Company Returns
Table 4 CAARs, Biopharmaceutical Companies, January–June 2020
Table 5 CAARs, Biopharmaceutical Companies, November 2020-April 2021
Figure 2 Net abnormal results by companies and subperiods (%). Top panel: First subperiod. COVID-19 pandemic announcements. Bottom panel: Second subperiod. COVID-19 vaccines announcements.
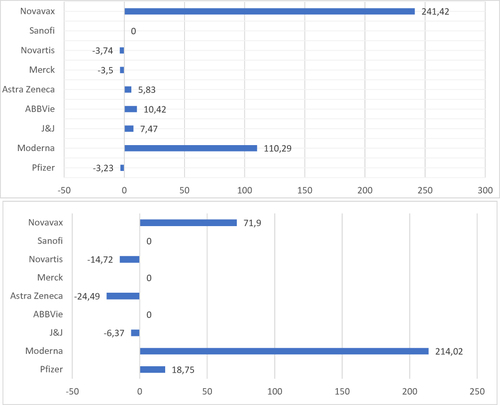
Table 6 CAARs, Biopharmaceutical Companies, Events Related to Government Purchase Agreements (July–August 2020)
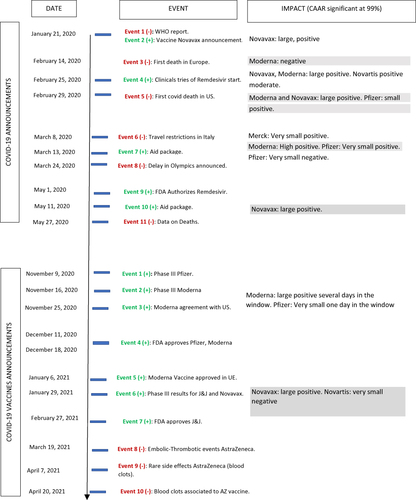
Figure 3 Summary of findings of Event Analysis for COVID-19 announcements and COVID-19 vaccines announcements.