
Figures & data
Table 1 Comparison of Gender and Age of Emergency Patients from January 23 to February 24, 2019, 2020 and 2021
Figure 1 Comparison of the number of patients and growth rate presenting to the ED in the same period in 2019, 2020, and 2021.
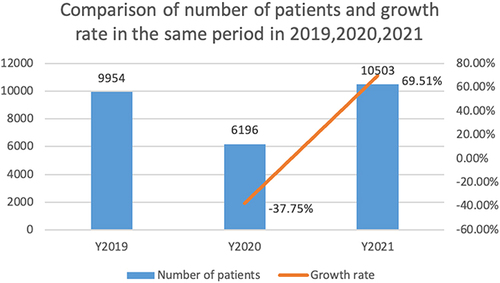
Figure 2 The number of critically ill patients managed by the ED across the three years.
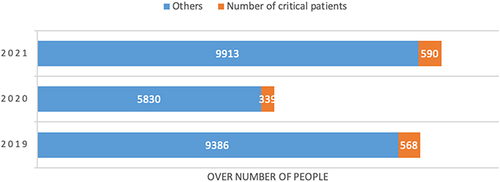
Table 2 Comparison of Disease Classifications for Critically Ill Patients Presenting via the ED from January 23 to February 24, 2019, 2020, and 2021
Figure 3 Comparison of disease classifications for critically ill patients presenting via the ED from January 23 to February 24, 2019, 2020, and 2021.
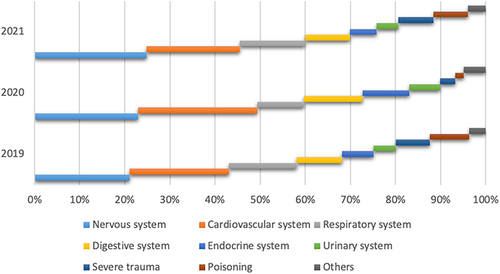
Table 3 Comparison of the Number of EACs, Hospitalizations, and Deaths from January 23 to February 24, 2019, 2020, and 2021