Figures & data
Table 1 Basic Data and Clinical Characteristics of Patients
Table 2 Clinical Indicators of Patients in the Two Groups
Figure 1 Clinical feature selection using LASSO binary logistic regression model. (A) Tuning parameter (λ) selection in the LASSO model used 10-fold cross-validation via minimum criteria. The AUC curve was plotted against log λ. Dotted vertical lines were drawn at the optimal values by using the minimum criteria ± 1 standard error (the 1-SE criteria). A λ value of 0.042, with log (λ) of −3.170 was chosen according to 10-fold cross-validation. (B) LASSO coefficient profiles of the 24 clinical indicators. A coefficient profile plot was produced against the log (λ) sequence. A vertical line was drawn at the value selected using 10-fold cross-validation, where optimal λ resulted in six nonzero coefficients. (C) The six selected indicators with the most discriminative value according to the best penalty parameter λ.
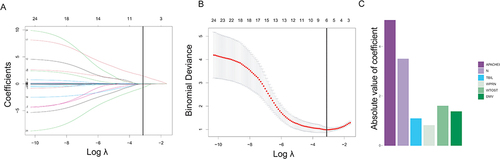
Table 3 Multivariate Logistic Regression Analysis of Clinical Indicators
Figure 2 Establishment and validation of clinical prediction model. (A) Nomogram lists of the prediction model; (B) ROC curves of the prediction model; (C) Calibration curves of the nomogram in the development cohort; (D) Calibration curves of the nomogram in the validation cohort.
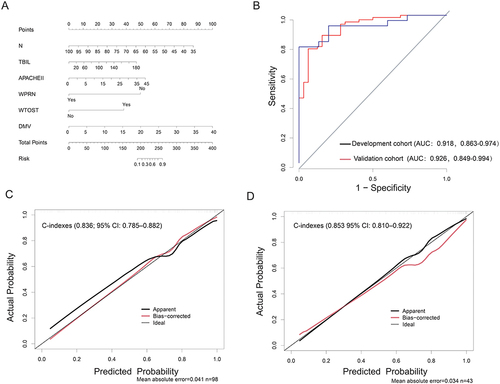
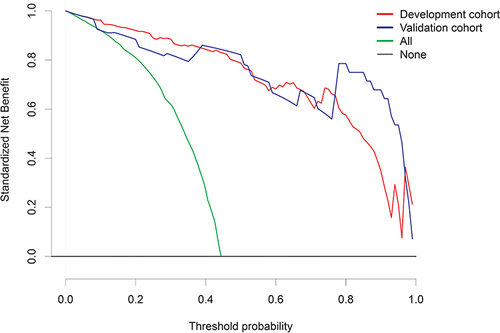
Figure 3 Nomogram decision curve analysis; y-axis measures = net benefit.