
Figures & data
Figure 1 The process of literature screening.
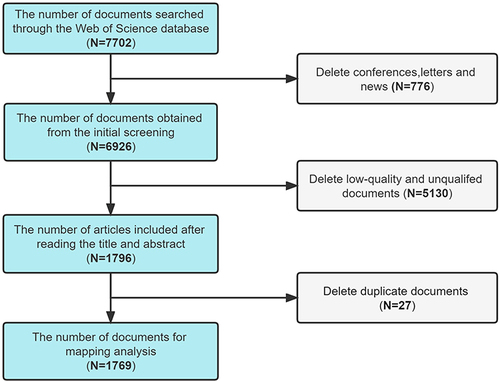
Figure 2 (A) Yearly output and score; (B) Distribution of global publications in the field of DRGs; (C) Academic cooperation networks between countries/regions.
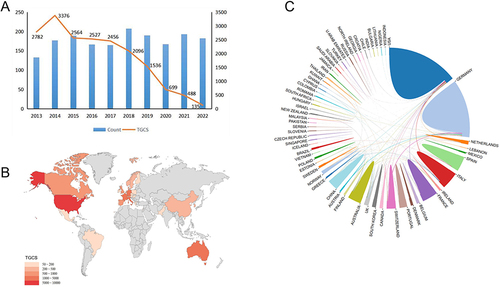
Table 1 The Top 10 Productive Countries in the Studies
Table 2 The Top 10 Institutions (Based on Records and TGCS Respectively)
Table 3 The Top 15 Journals (Based on TGCS)
Figure 3 (A) Academic cooperation networks between institutions; (B) Academic cooperation networks between authors.
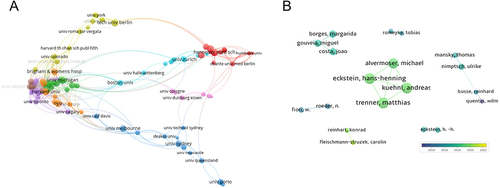
Table 4 The Top 20 Keywords
Figure 4 (A) The top 20 strongest strength citation burst; (B) Networks of keywords in the studies.
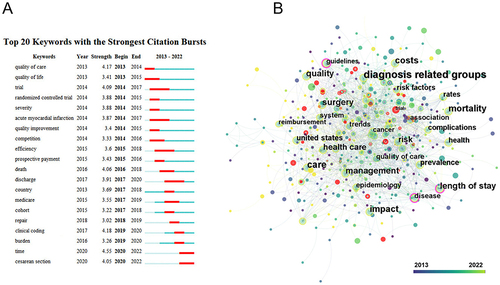
Table 5 Key Articles in Each Cluster
Figure 5 The cluster map of document co-citation.
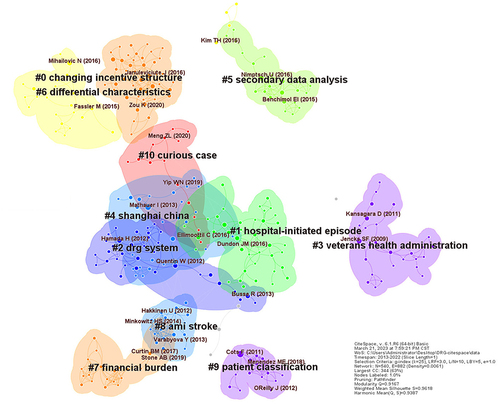
Table 6 Top 10 Articles (Based on TGCS)
Figure 6 Different classifications of DRGs.
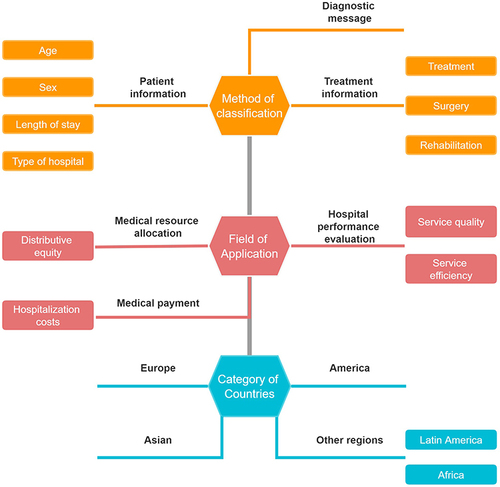
Table 7 Advantages and Disadvantages of DRGs