
Figures & data
Figure 1 ![]()
Figure 2 Stationarity test of VAR system. All the unit roots (blue dot) were inside the unit circle, which means that the VAR sequence was stationary.
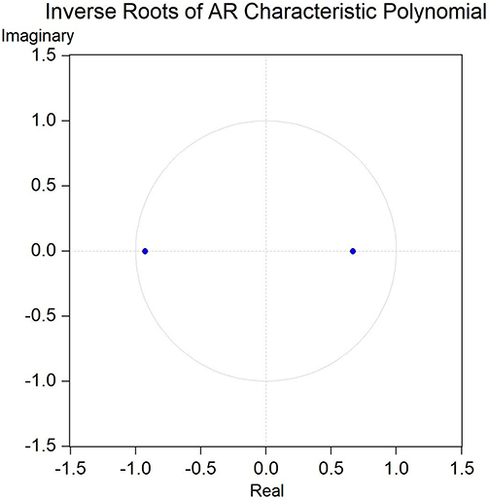
Figure 3 Response of EMADR_TOTAL to TV perturbation. Blue line is trace of impulse response values, between the red dotted lines are the response standard errors.
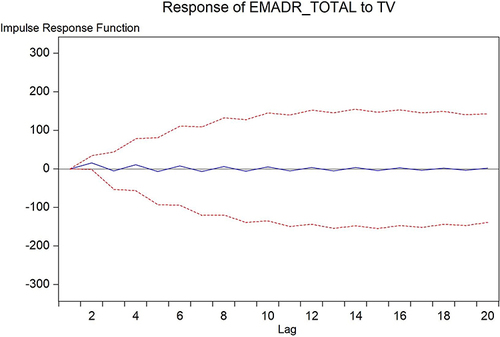
Figure 4 Response of EMADR_TOTAL to self-disturbance. Blue line is trace of impulse response values, between the red dotted lines are the response standard errors.
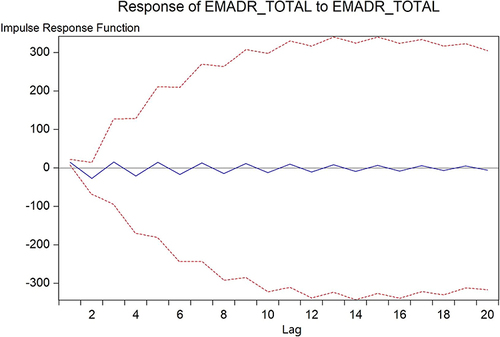
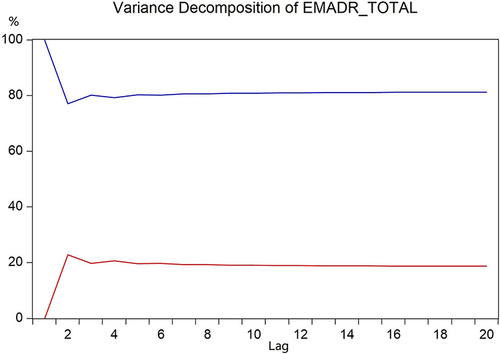
Figure 5 ![]()
Data Sharing Statement
The datasets used and/or analysed in the current study were collected from the National Health and Family Planning Development Statistical Bulletin and the National Annual Report on Adverse Drug Reaction Monitoring. These data are also available from the corresponding author upon reasonable request.