Figures & data
Table 1 Baseline Information of ICU Healthcare Personnel
Figure 1 Correlation plot of all analysed features. ICU, Intensive Care Unit.
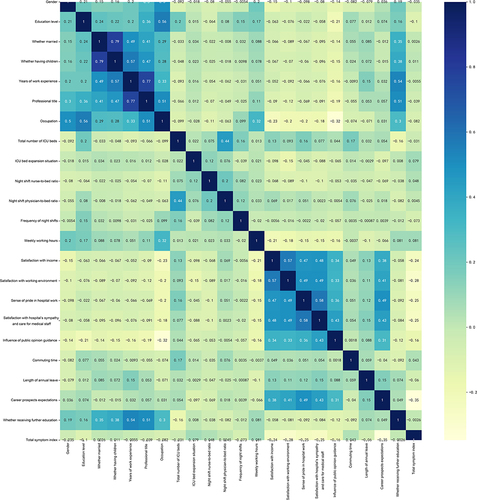
Figure 2 Cumulative importance versus the number of features.
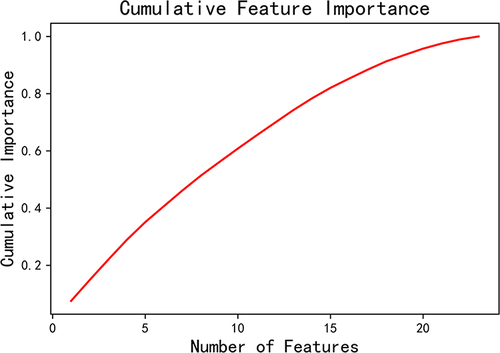
Figure 3 ROC-AUC Curve. AUC indicates area under the curve; ROC, Receiver operating characteristic.
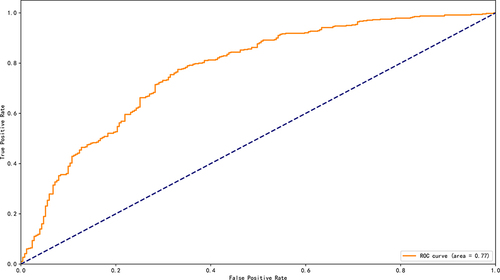
Figure 4 Feature Importance Plot.
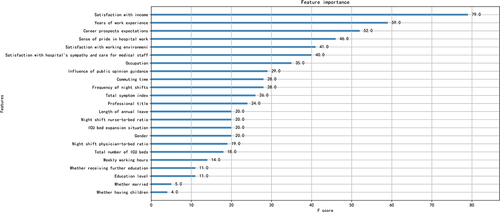
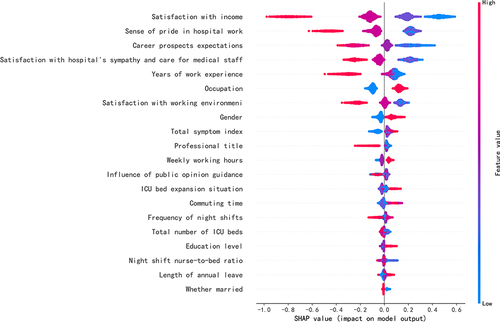
Figure 5 SHAP Plot. SHARP, SHapley Additive exPlanations. Features are ranked in descending order of their accountability for the prediction. Each dot in the visualization represents one datapoint of a feature. Its color is related to the real data value: high value in red and low value in blue. The impact of each value is associated with higher or lower prediction, represented by SHAP values on x-axis.