
Figures & data
Table 1 The Demographic Characteristics of 539 Patients
Figure 1 Flow diagram illustrating the study population.
Abbreviation: NIPT, Non-invasive Prenatal Testing.
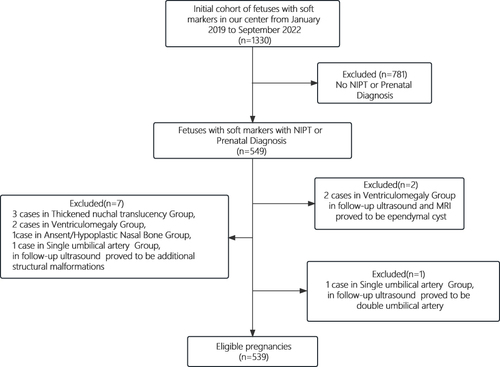
Table 2 Phenotypic Characteristics of 539 Pregnancies with Ultrasonic Soft Markers
Table 3 Summary of Chromosomal Aberrations in 539 Fetuses with Soft Markers
Figure 2 Comparative flow diagram of the NIPT Group and the invasive prenatal diagnosis Group.
Abbreviation: NIPT, Non-invasive Prenatal Testing.
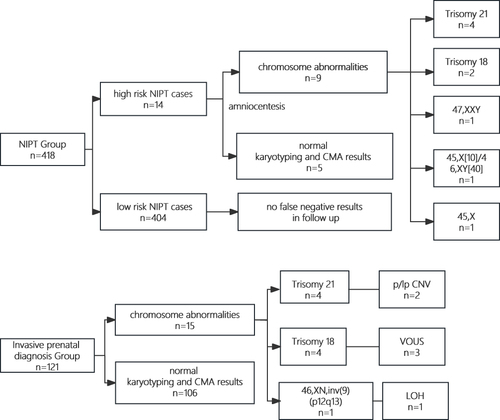
Table 4 Abnormalities Detected and Clinically Relevant Characteristics in Fetuses with Ultrasonic Soft Markers
Table 5 Chromosomal Aberrations with Ultrasonic Soft Markers in Advanced Maternal Age