Figures & data
Table 1 Sample Size Calculation
Table 2 Comparison of Characteristics Between the Training and Validation Sets
Figure 1 Visualization of LASSO regression analysis results. (A) Changes in LASSO regression coefficients. (B) Cross-validation identifies the optimal lambda value; the left dashed line corresponds to the lambda that yields the minimum mean, indicating optimal model performance.
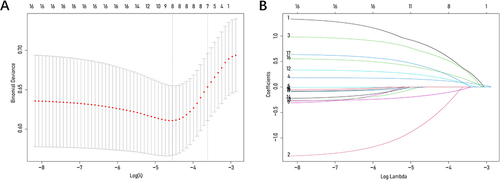
Figure 2 Clinical feature selection using a random forest. (A) Relationship between trees and errors in a random forest. (B) Variable importance ranking in a random forest.
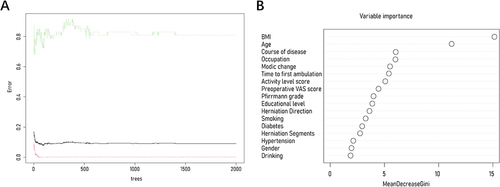
Figure 3 The ROC curve of the predictive model for forecasting PRLDH occurrence. (A) Training group. (B) Validation group; Calibration curve of the predictive model for forecasting PRLDH occurrence. (C) Training group. (D) Validation group. Decision curve analysis and Nomogram of the model for forecasting PRLDH occurrence. (E) Training group. (F) Validation group.
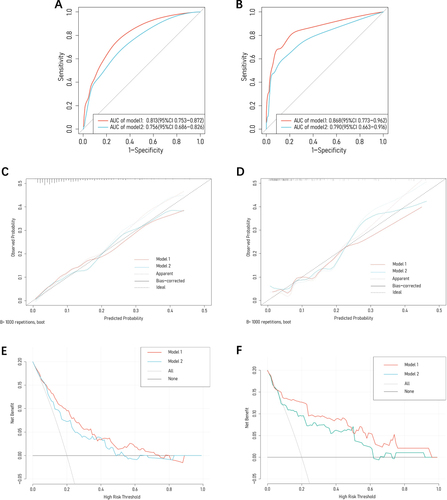
Table 3 Logistic Regression Analysis of Risk Factors for PRLDH Occurrence in the Trainset Patients
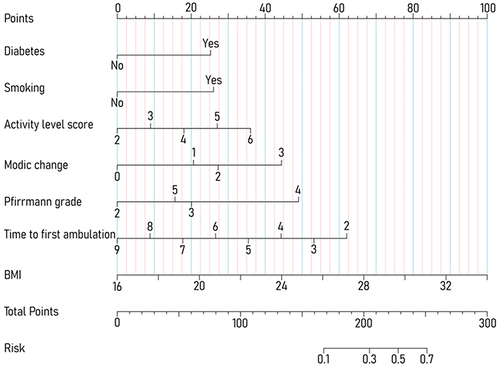
Figure 4 Nomogram for predicting PRLDH.