Figures & data
Table 1 Sample Characteristics of 28,760 Participants Included in Our Study
Table 2 Distribution of Responses and Percentages for TIP Outcome
Table 3 The Results of the Univariate Analysis
Table 4 Multilevel Regression Analysis About the Association Between TIP and Different Covariates
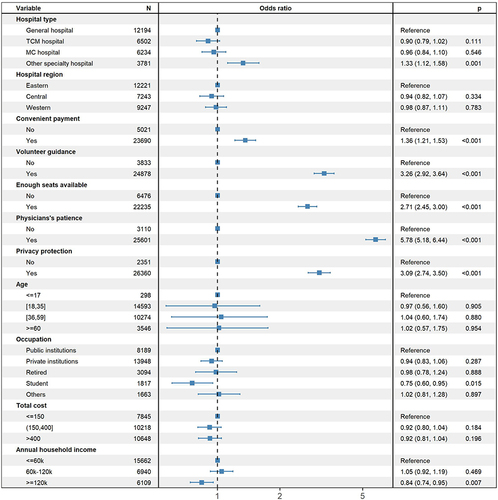
Figure 1 Sensitive analysis using multilevel regression model by removing participants answering with “moderate”.
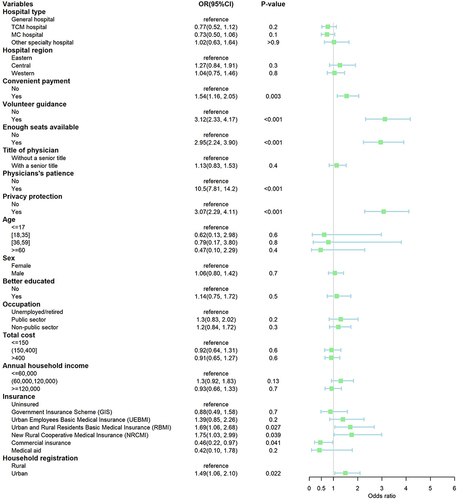
Figure 2 The results of the association between TIP and covariates based on ordinary logistic regression model without including multiple levels.