Figures & data
Table 1 Clinical Characteristics of All Participants
Figure 1 Baseline characteristics of all populations. (A) Pie chart of age composition ratios (N=50038). (B) Obesity and overweight rates among all populations (N=49217). (C) Obesity and overweight rates among males (N=27351). (D) Obesity and overweight rates among females (N=21866). (E) Percentage of tobacco use (N=50038). (F) Percentage of alcohol use (N=50038). (G) Percentage of waist circumference and waist-to-Hip ratio in men (N=27351). (H) Percentage of waist circumference and waist-to-Hip ratio in women (N=21866). (I) Prevalence of chronic diseases in all population groups (N=50038).
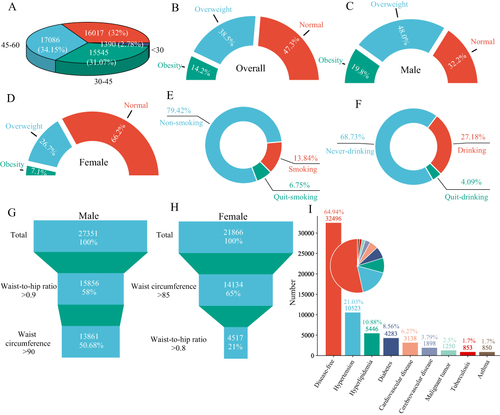
Figure 2 Prevalence of metabolic abnormalities. (A) Prevalence of hypertension in all populations. (B) Prevalence of dyslipidaemia in all populations. (C) Prevalence of diabetes in all populations. (D) Prevalence of hyperuricaemia and hyperhomocysteinemia in all populations.
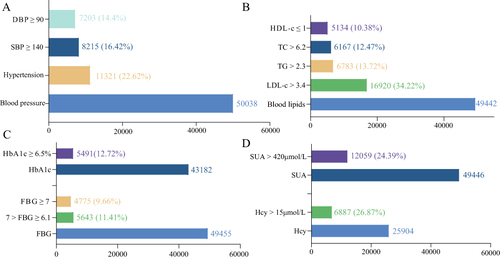
Figure 3 Prevalence of metabolic abnormalities based on gender subgroups. (A) Prevalence of hypertension in male and female subgroups. (B) Prevalence of dyslipidaemia in male and female subgroups. (C) Prevalence of diabetes in male and female subgroups. (D) Prevalence of hyperuricaemia and hyperhomocysteinemia in male and female subgroups. Comparisons between gender subgroups were made using the chi-squared test.
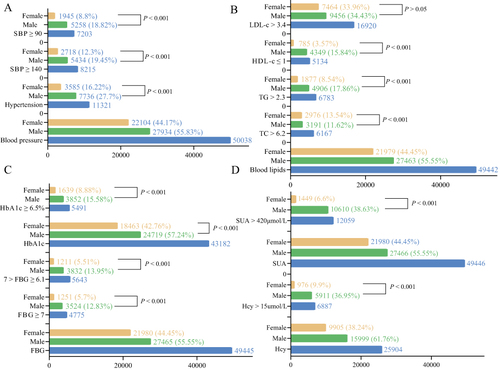
Figure 4 Prevalence of abnormal ultrasound findings. (A) Abdominal ultrasound. (B) Prostate ultrasound. (C) Breast ultrasound. (D) Thyroid ultrasound. (E) Carotid ultrasound and lung CT. (F) Cardiac ultrasound.
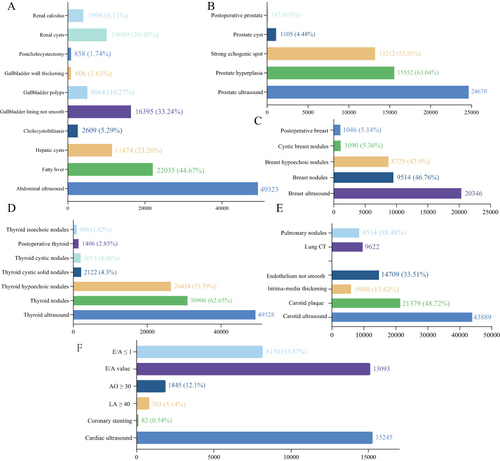
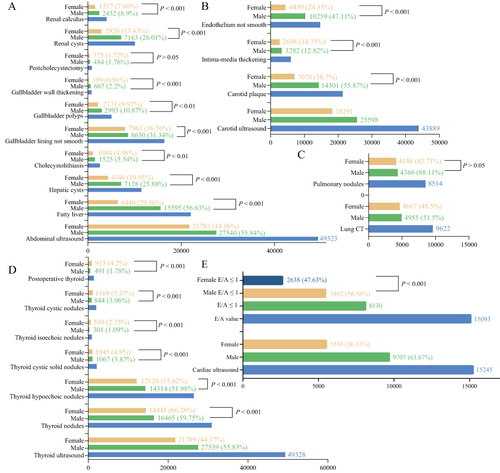
Figure 5 Prevalence of abnormal ultrasound findings based on gender subgroups. (A) Abdominal ultrasound. (B) Carotid ultrasound. (C) Lung CT. (D) Thyroid ultrasound. (E) Cardiac ultrasound. Comparisons between gender subgroups were made using the chi-squared test.