
Figures & data
Table 1 Basic Information of Beds of the Department of Stomatology in Chinese Hospitals
Table 2 Gini Coefficient of Beds of the Department of Stomatology in Chinese Hospitals
Figure 1 Lorentz curves of beds of the department of stomatology in Chinese hospitals in 2017 (A) and 2021 (B).
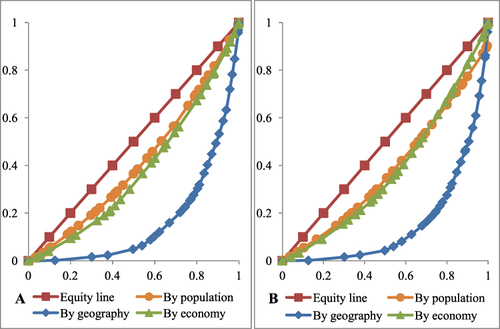
Table 3 Theil Index of Beds of the Department of Stomatology in Chinese Hospitals
Figure 2 Theil index Contribution rate of beds of the department of stomatology in Chinese hospitals.
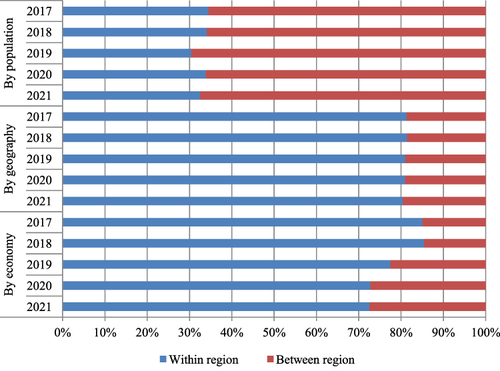
Table 4 Agglomeration Degree of Beds of the Department of Stomatology in Chinese Hospitals
Table 5 Prediction Model and Test Results of Beds of the Department of Stomatology in Chinese Hospitals
Table 6 Prediction Results of Beds of the Department of Stomatology in Chinese Hospitals, 2022–2026
Data Sharing Statement
The data for this study are available at China Health Statistics Yearbook (http://www.nhc.gov.cn). The specific situation has been explained in the text.