
Figures & data
Figure 1 Flow chart of this study.
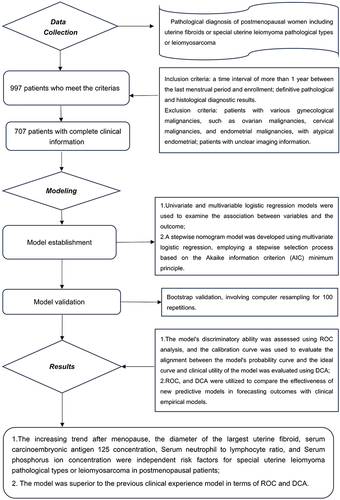
Table 1 Baseline Characteristics of the Enrolled Participants
Table 2 Association of UL with Selected Variables in Bivariate Analysis and in Multivariable Models
Figure 2 Nomogram prediction of UL for special pathological types or leiomyosarcoma in postmenopausal women trend: the increasing trend after menopause, size: the diameter of the largest uterine fibroid, CA125: serum carcinoembryonic antigen 125 concentration, NLR: Serum neutrophil to lymphocyte ratio, Ph: Serum phosphorus ion concentration.
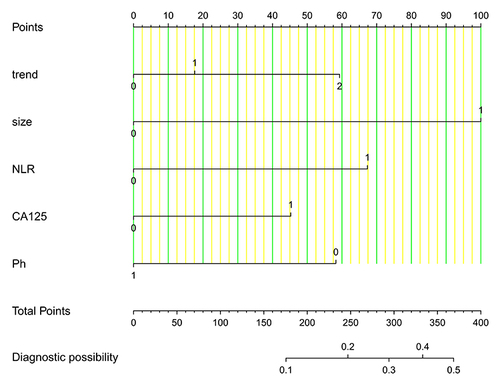
Figure 3 Receiver operating characteristic curve.
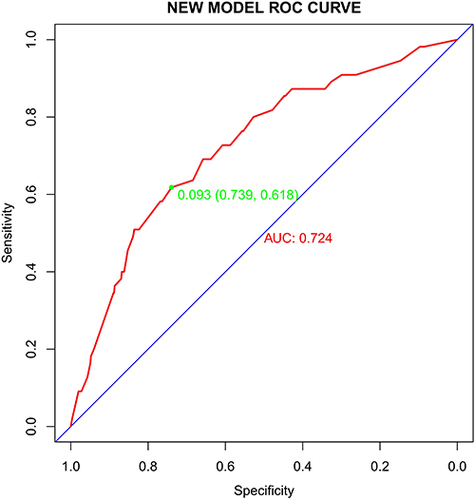
Figure 4 Calibration plot for predicted probability of special uterine leiomyoma pathological types or leiomyosarcoma. When the solid black line (Logistic calibration) was closer to the grey line (ideal model), the prediction accuracy of the nomogram was better.
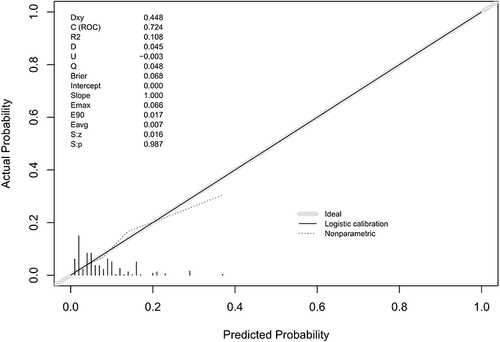
Figure 5 DCA for the prediction model. Red solid line: Prediction model; the gray line: Assume all postmenopausal patients have special uterine leiomyoma pathological types or leiomyosarcoma. Solid horizontal line: Assume no postmenopausal patients have special uterine leiomyoma pathological types or leiomyosarcoma. The graph indicates the expected net benefit per patient relative to the nomogram prediction of special uterine leiomyoma pathological types or leiomyosarcoma; model new: new 5 factor model.
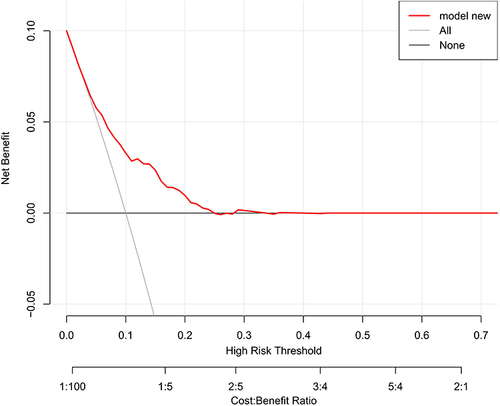
Figure 6 Comparison chart of AUC curve between our 5 factors model and clinical experience model. Black solid line: the AUC of new 5 factor model; Red solid line: the AUC of clinical experience model; model new: new 5 factor (changing trend after menopause, the diameter of the largest UL indicated by B-ultrasound, CA125, NLR, and Serum phosphorus ion concentration) model; model clinical: clinical experience (clinical symptoms related to UL, changing trend of UL after menopause, and diameter of the largest UL indicated by B-ultrasound) model.
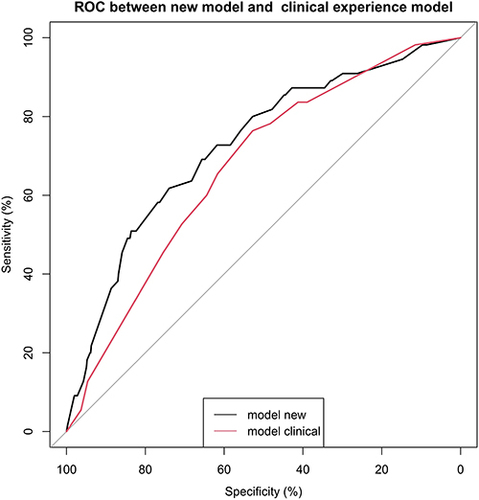
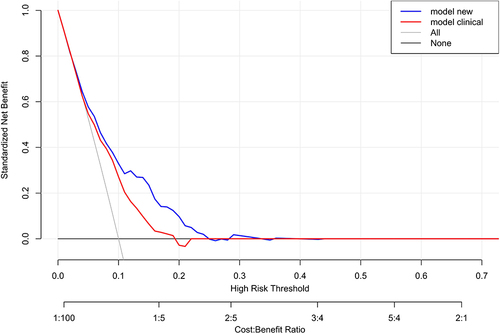
Figure 7 DCA between our 5-factor model (model new) and clinical-experience model (model clinical). Blue solid line: the DCA of new 5 factor model; Red solid line: the DCA of clinical model; model new: new 5 factor (changing trend after menopause, the diameter of the largest UL indicated by B-ultrasound, CA125, NLR, and Serum phosphorus ion concentration) model; model clinical: clinical experience (clinical symptoms related to UL, changing trend of UL after menopause, and diameter of the largest UL indicated by B-ultrasound) model.
Data Sharing Statement
The data used for analysis is fully available in the manuscript file without restriction.