
Figures & data
Table 1 Description of Total and Cause-Specific Emergency Visits During Pre- and Post-Pandemic Periods
Figure 1 Change in the number of emergency visits and the composition of diseases in each quarter from January 2018 to September 2023.
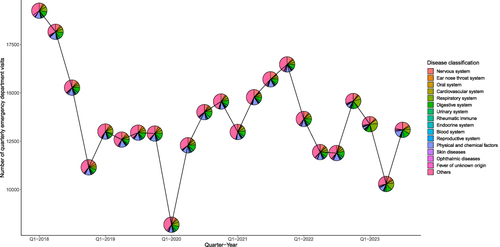
Table 2 Results of Parameter Estimation for the Interrupted Time Series Model of Emergency Department Visits
Figure 2 Trend of the weekly emergency visits for all diseases from January 2018 to September 2023.
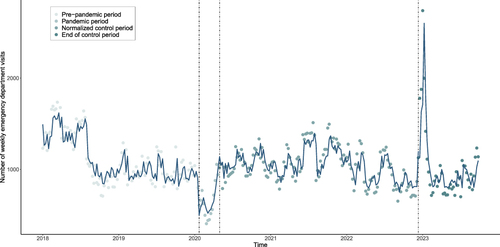
Figure 3 Trend of weekly emergency visits for respiratory diseases from January 2018 to September 2023.
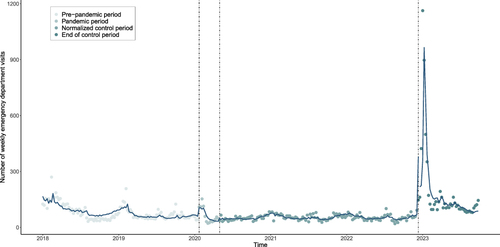
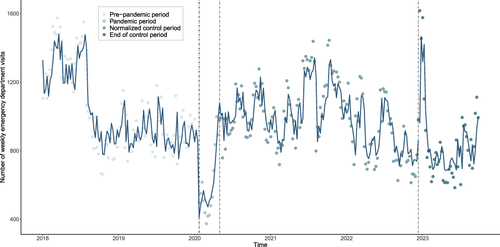
Figure 4 Trend of weekly emergency visits for non-respiratory diseases from January 2018 to September 2023.
Data Sharing Statement
The datasets used and/or analyzed during the current study are available from the corresponding author upon reasonable request.