Figures & data
Figure 1 Flowchart of data screening and modeling.
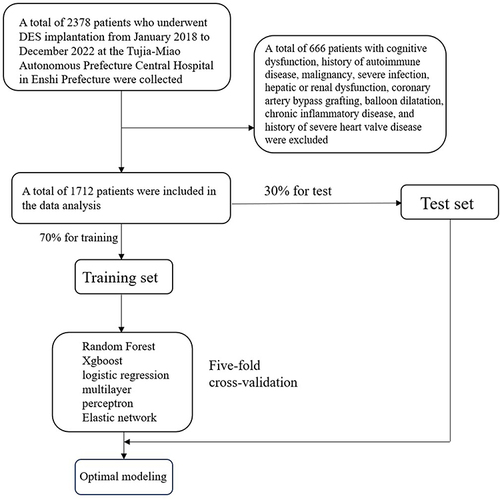
Table 1 The Baseline Characteristics of the Subjects Between ISR Group and Non-ISR Group
Table 2 Performance Evaluation of Five Models
Figure 2 ROC curve of the model.
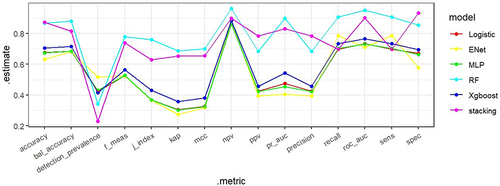
Figure 3 Comparison of calibration curves of each model.
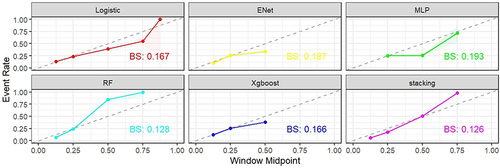
Figure 4 Importance plot of predictor variables.
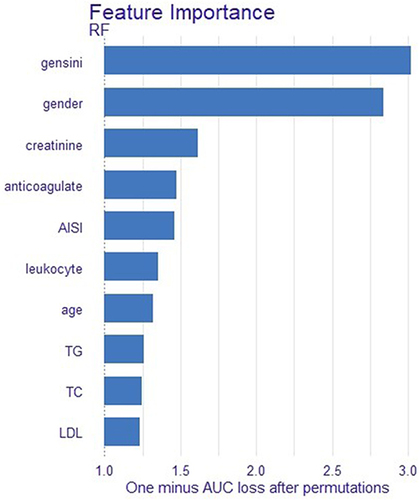
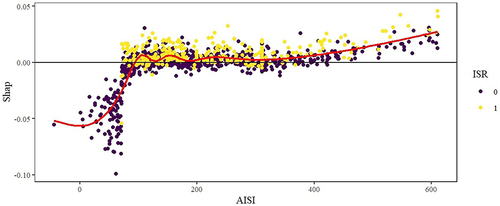
Figure 5 Dot plot of predictor variable importance.