
Figures & data
Table 1 Demographic and clinicopathological patient data
Figure 1 Whole-body fluorodeoxyglucose (FDG)-positron emission tomography (PET)/computed tomography (CT) images showing focal tracer’s uptake (maximum standard uptake value 10,47) located in the right true and false vocal cord. (A) CT image, (B) PET/CT image. The red oval in imaging indicates the lesion.
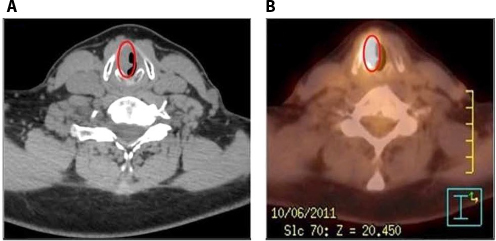
Table 2 Value of positron emission tomography (PET)-computed tomography (CT) in the diagnosis of primary or nodal laryngeal cancer recurrence