Figures & data
Figure 1 Resolution in conventional fluorescence microscopy.
Notes: (A) Light emitted by a point source (fluorescent protein or organic fluorophore) is detected by the optical microscope as a PSF of width which depends on the wavelength of emission and the light collection capacity of the objective. (B) The diffraction of light limits the resolution of the system such that emitters closer than the width of the PSF cannot be resolved, leading to a loss of structural detail.
Abbreviations: PSF, point spread function; NA, numerical aperture.
Abbreviations: PSF, point spread function; NA, numerical aperture.
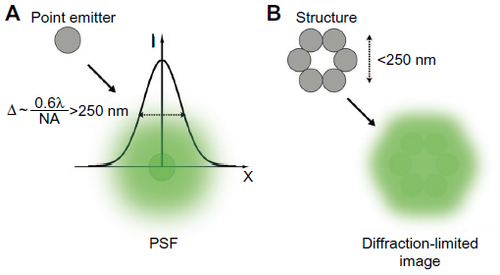
Figure 2 Superresolution microscopy techniques.
Notes: From left to right: principles underlying detection for each method, acquisition schemes, resulting images. (A) In STED, a depletion doughnut-shaped beam is combined with the focused excitation light, thus decreasing the size of the PSF to a volume smaller than the diffraction limit (left). Acquisition (middle) is performed by scanning the two perfectly aligned light sources over the sample with the emitted light collected pixel by pixel by a detector (PMT or APD). (B) In SIM, the excitation of a structure with nonuniform light pattern results in an upshift of the sample spatial frequencies, resulting in Moiré fringes (left). A 3D SIM acquisition (middle) is performed by laterally displacing the illumination pattern (five phases) in three orientations (angles) of the sinusoidal stripes, and spatially modulated images are recorded by a CCD camera. (C) In SMLM, the position of individual emitters is obtained by fitting of their intensity profile detected by a CCD camera (left). The acquisition (middle) relies on the low density of emitting fluorophores (<1/250 nm). The single localizations are then combined to reconstruct the superresolved image (right).
Abbreviations: APD, avalanche photodiode; CCD, charge-coupled device; PMT, photon multiplier tube; PSF, point spread function; SIM, structured illumination microscopy; SMLM, single-molecule localization microscopy; STED, stimulated emission depletion; 3D, three-dimensional.
Abbreviations: APD, avalanche photodiode; CCD, charge-coupled device; PMT, photon multiplier tube; PSF, point spread function; SIM, structured illumination microscopy; SMLM, single-molecule localization microscopy; STED, stimulated emission depletion; 3D, three-dimensional.
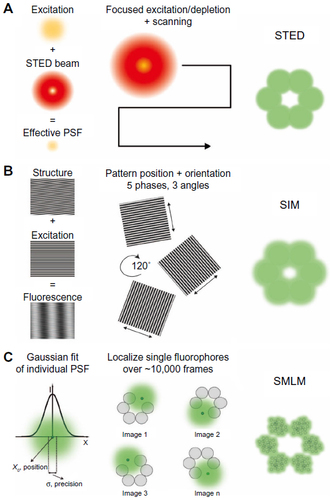
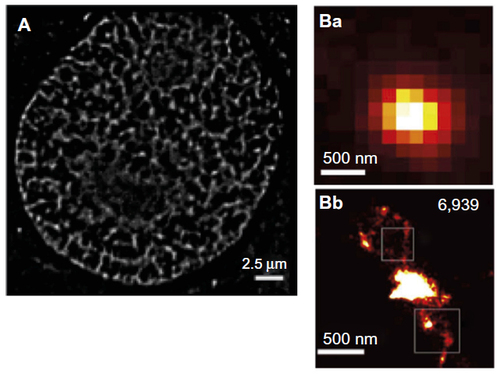
Figure 3 Chromatin labeling strategies for single-molecule localization microscopy.
Notes: (A) A 2D live cell dSTORM of DNA in U2OS cells based on direct DNA labeling with PicoGreen. Note the sparser distribution obtained here compared to the rest of the images, which may be due to incomplete labeling or detection. Copyright © 2012 WILEY-VCH Verlag GmbH & Co. KGaA, Weinheim. Figure adapted with permission from John Wiley and Sons. Adapted from: Benke A, Manley S. Live-Cell dSTORM of cellular DNA based on direct DNA labeling. ChemBioChem. 2012;13(2):298–301.Citation90 (B) Subdiffraction (Ba) and superresolution (Bb) image of the bithorax complex domain using Oligopaint; the squares indicate regions where linear densities can be observed; number of events (6,9369) is shown at top right of figure. Copyright © 2015, Rights Managed by Nature Publishing Group. This work is licensed under a Creative Commons Attribution 4.0 International License; please note the Disclaimer of Warranties and Limitation of Liability: http://creativecommons.org/licenses/by/4.0/legalcode. Figure adapted from: Beliveau BJ, Boettiger AN, Avendaño MS, et al. Single-molecule super-resolution imaging of chromosomes and in situ haplotype visualization using Oligopaint FISH probes. Nat Commun. 2015;6:7147. Available at: http://www.nature.com/ncomms/2015/150512/ncomms8147/full/ncomms8147.html.Citation121
Abbreviations: dSTORM, direct stochastic optical reconstruction microscopy; hFb, human fibroblast.
Abbreviations: dSTORM, direct stochastic optical reconstruction microscopy; hFb, human fibroblast.