Figures & data
Figure 1 Representative images of organization of SEPT9 filaments in mammalian cells at different stages of the cell cycle.
Notes: (A) In early anaphase, SEPT9 filaments (red) disassemble and can be observed as punctuated staining in the cytoplasm, as well as more filamentous structures along the plasma membrane. (B) During late telophase, SEPT9 staining is visible as a ring structure along the cleavage furrow, resembling the morphology of budding yeast. (C) In interphase cells, SEPT9 assembles into filaments whose morphology varies between rings and filaments in different cell lines. In MDA-231 cells, both filaments and rings are clearly visible. (D) Schematic representation of septin domains: proline-rich domain (green), polybasic domain (gray), GTPase domain (yellow), SUE domain (orange) and the coiled-coil domain (blue). Images for (A–D) were acquired in Dr Cristina Montagna laboratory at Albert Einstein College of Medicine.
Abbreviation: SUE, septin-unique element.
Abbreviation: SUE, septin-unique element.
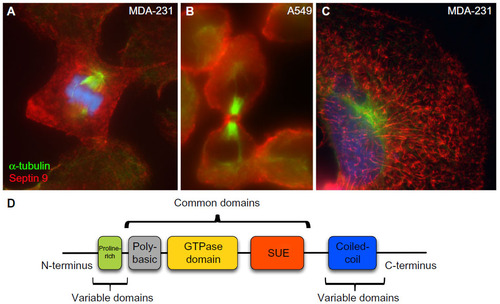
Table 1 Chromosomal mapping and transcriptional variants of Septin family members
Figure 2 Representation of the crystal structure of the SEPT7, SEPT2, and SEPT2 complex.
Notes: The 25 nm septin-filament length comprises a hexamer assembled via direct interaction of the SEPT7, SEPT2, and SEPT2 trimer. The arrows represent the presumed orientations of the C-terminal ends. Reprinted with permission from Macmillan Publishers Ltd: Sirajuddin M, Farkasovsky M, Hauer F, et al. Structural insight into filament formation by mammalian septins. Nature. 2007;449:311–315. © Copyright 2007.Citation31
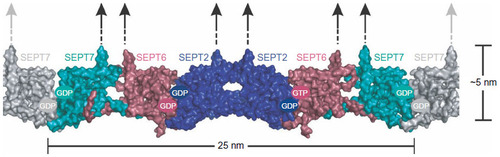
Figure 3 Plotting of frequency (y-axis) of copy-number alterations (CNAs) observed in cancer patients analyzed as part of the Cancer Genome Atlas (TCGA).
Notes: Members of the septin family of genes are color-coded as indicated on the right. Tumor histologies are indicated on the x-axis. Breast dataset;Citation45 colorectal dataset;Citation46 lung carcinoma;Citation47,Citation48 uterine carcinoma.Citation134 Provisional data have been plotted by searching the CBioPortal for Cancer Genomics.Citation128,135
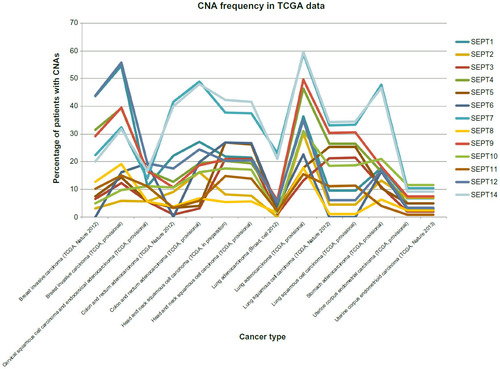
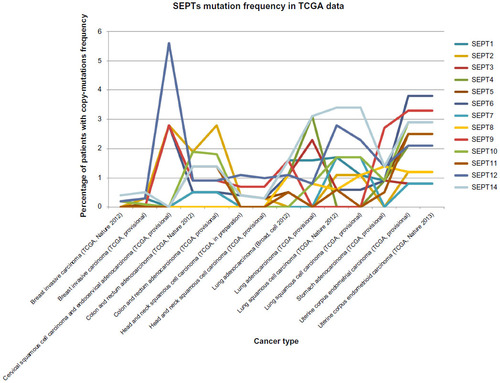
Figure 4 Plotting of mutation frequency (y-axis) observed in cancer patients analyzed as part of the Cancer Genome Atlas (TCGA).
Notes: Members of the septin family of genes are color-coded as indicated on the right. Tumor histologies are indicated on the x-axis. Breast dataset;Citation45 colorectal dataset;Citation46 lung carcinoma;Citation47,Citation48 uterine carcinoma.Citation134 Provisional data have been plotted by searching the CBioPortal for Cancer Genomics.Citation128,135