Figures & data
Figure 1 T1 mapping in a healthy volunteer.
Notes: (A) Native T1 MOLLI map (myocardial T1 1,010 ms). (B) Post-contrast T1 MOLLI map (myocardial T1 615 ms). (C) ECV map (ECV =26.5%).
Abbreviations: ECV, extracellular volume; LV, left ventricle; MOLLI, modified Look–Locker inversion recovery; RV, right ventricle.
Abbreviations: ECV, extracellular volume; LV, left ventricle; MOLLI, modified Look–Locker inversion recovery; RV, right ventricle.
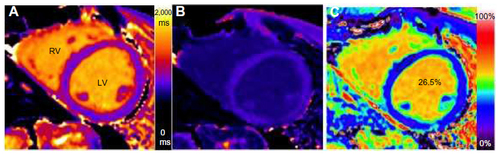
Figure 2 Examples of native T1 maps from a healthy volunteer using three different sequences.
Notes: (A) MOLLI, (B) ShMOLLI, and (C) SASHA, each demonstrating regions of interest and their values. Note the difference in values. MOLLI and ShMOLLI can underestimate native myocardial T1 in comparison to a standard spin echo acquisition, whereas SASHA yields a higher accuracy and lower precision compared with MOLLI and ShMOLLI.
Abbreviations: MOLLI, modified Look–Locker inversion recovery; SASHA, saturation recovery single-shot acquisition; ShMOLLI, shortened MOLLI.
Abbreviations: MOLLI, modified Look–Locker inversion recovery; SASHA, saturation recovery single-shot acquisition; ShMOLLI, shortened MOLLI.
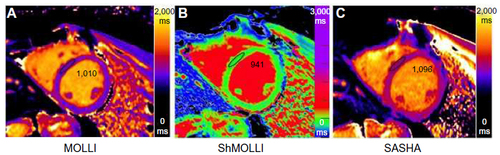
Figure 3 Native T1 maps in the basal short axis.
Notes: (A) Healthy volunteer. The myocardium appears homogeneously green and the blood is red. (B) Cardiac amyloid. The myocardium has a higher T1 value (red). (C) Severe iron overload. The myocardium appears blue as the T1 value is low from iron. (D) Anderson-Fabry disease. The myocardium has a lower T1 value (blue) due to intracellular lipid accumulation, except in the inferolateral wall, which is red due to fibrosis (black arrow).
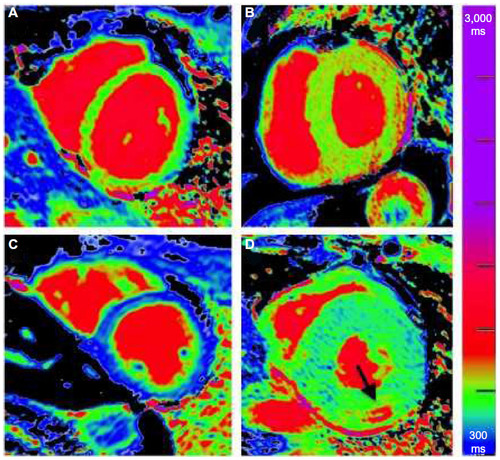
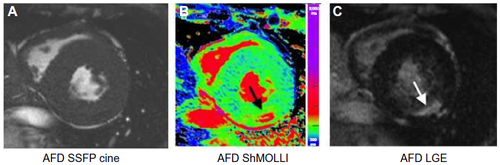
Figure 4 Anderson-Fabry disease.
Notes: (A) A short-axis SSFP cine imaging showing severe concentric hypertrophy. (B) Native T1 value map (ShMOLLI) demonstrating low T1 (blue myocardium) with an area of fibrosis (black arrow) in the inferolateral wall. (C) LGE image demonstrating scar in the same region (white arrow).
Abbreviations: AFD, Anderson-Fabry disease; LGE, late gadolinium enhancement; ShMOLLI, shortened modified Look–Locker inversion recovery; SSFP, steady-state free precession.
Abbreviations: AFD, Anderson-Fabry disease; LGE, late gadolinium enhancement; ShMOLLI, shortened modified Look–Locker inversion recovery; SSFP, steady-state free precession.