Figures & data
Table 1 Symptoms of insulinoma and frequency
Figure 1 The distribution of the sensitivity rate of preoperative noninvasive and invasive methods in the localization of insulinoma, in all published cases (n=6,222).
Abbreviations: Angio, angiography; CT, computed tomography; EUS, endoscopic ultrasonography; MRI, magnetic resonance imaging; SACS, selective arterial calcium stimulation; THPVS, transhepatic portal venous sampling; US, ultrasound.
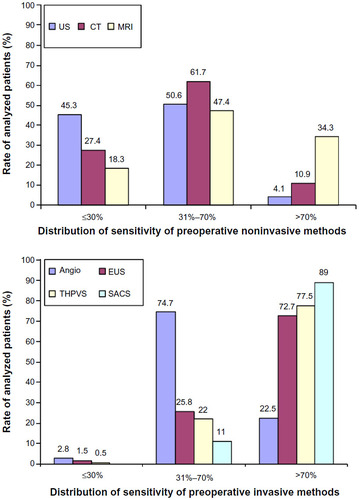
Figure 2 Left hepatic vein insulin concentrations after intra-arterial calcium injections.
Abbreviations: GDA, gastroduodenal artery; MRI, magnetic resonance imaging; SMA, superior mesenteric artery; R, right; L, left; T, tumor.
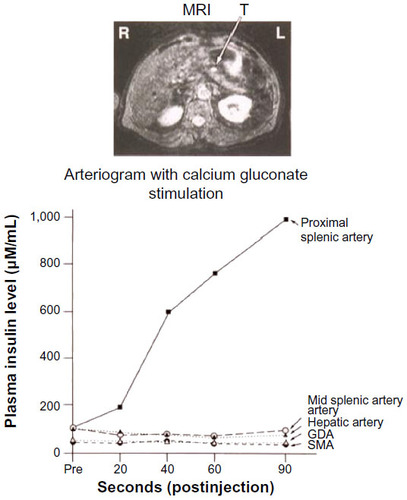
Figure 3 The distribution of sensitivity rates of intraoperative modalities in the localization of insulinoma, in all published cases (n=6,222).
Abbreviations: IOUS, intraoperative ultrasound; IOGM, intraoperative glucose monitoring.
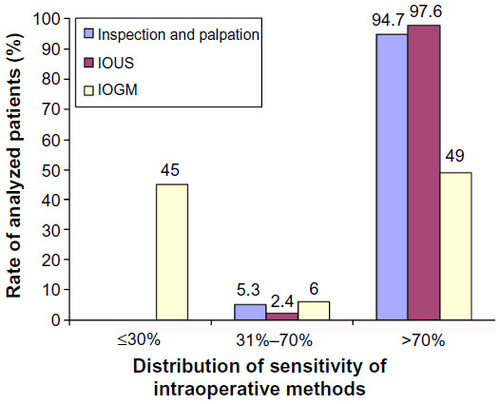
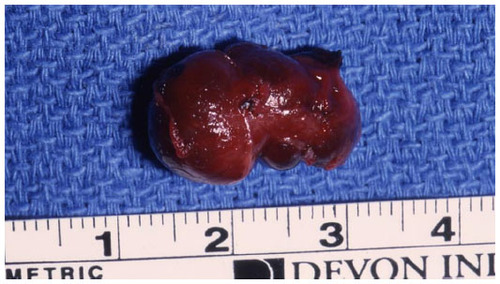
Figure 4 Intraoperative view of insulinoma.
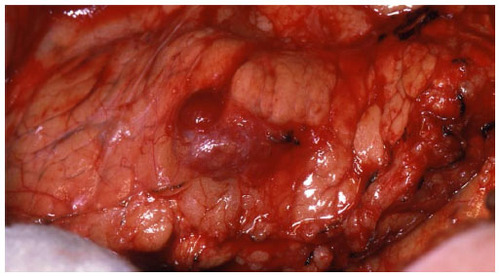
Figure 5 IOUS placed on insulinoma in to identify the location of the mass in relation to vascular structures and pancreatic duct.
Abbreviation: IOUS, intraoperative ultrasound.
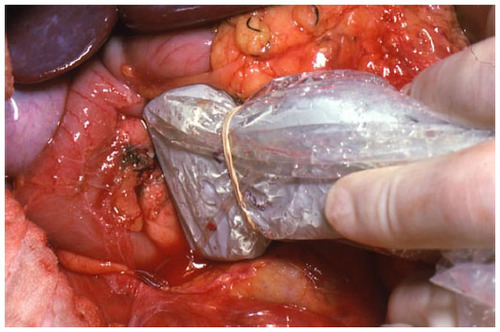
Figure 6 IOUS of and .
Abbreviation: IOUS, intraoperative ultrasound.
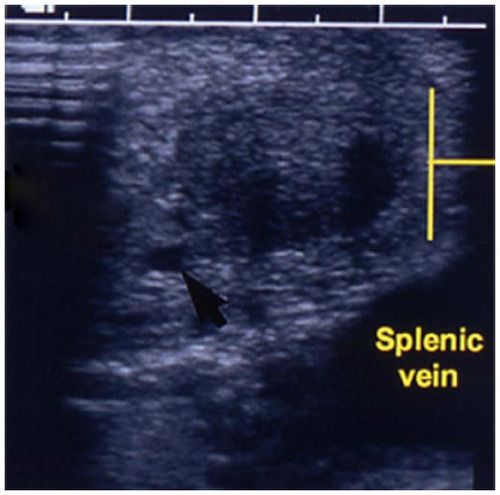
Figure 7 Enucleation of insulinoma seen in , , and .
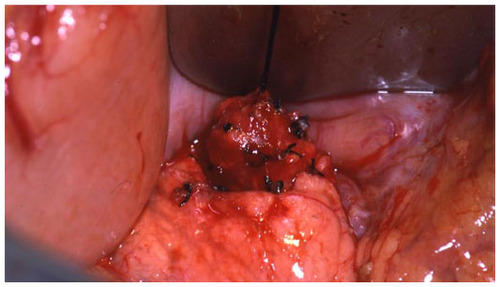
Figure 8 Final specimen of insulinoma as shown in , , , and .