
Figures & data
Figure 1 Duplex Doppler sonography of the right hepatic vein in a healthy control subject shows triphasic waveform. Two antegrade peaks are separated by a short phase of retrograde flow (A). Duplex Doppler sonography of the right hepatic vein in a subject with moderate hepatosteatosis shows biphasic waveform without reversed flow (B). Duplex Doppler sonography of the right hepatic vein in a subject with severe hepatosteatosis shows monophasic waveform with continuous flat flow (C).
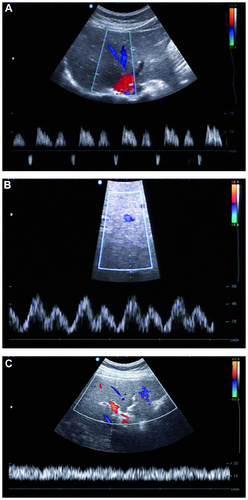
Figure 2 Duplex Doppler sonography of the portal vein in a healthy control subject with continuous hepatopetal flow.
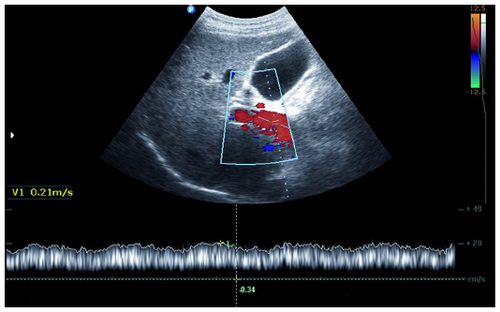
Table 1 Basic clinical and pathological characteristics of the patients
Table 2 Flow pattern of hepatic veins
Figure 3 Box and whisker plot diagram shows hepatic vein flow pattern in relation to total histologic activity index (necroinflammatory score) in 118 patients with chronic hepatitis C. Duplex Doppler sonography and liver biopsy were performed on same occasion. Mean total histologic activity index of patients with tri-, bi-, and monophasic flow patterns was 4.8±1.5, 6.7±0.6 and 8.2±1.5, respectively. Note that difference between the three flow patterns in correlation with the total histologic activity index (necroinflammatory score) was significant (P<0.001).
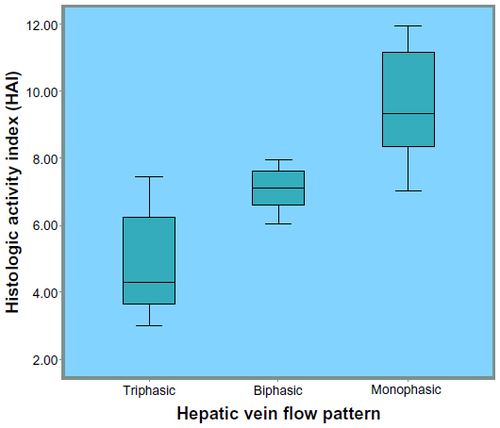
Table 3 Modified histologic activity index results
Figure 4 Linear regression analysis illustrates the relationship between hepatic veins flow pattern and histologic activity index (necroinflammatory score) among patients with HCV infection. (r=958, r2=0.924±0.602, P<0.001).
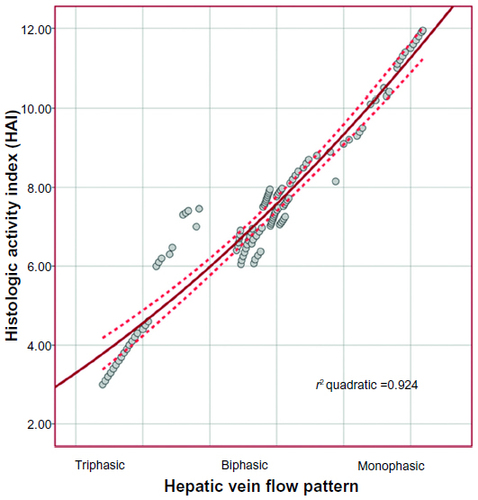
Figure 5 Box and whisker plot diagram shows hepatic vein flow pattern in relation to Ishak fibrosis score in 118 patients with chronic hepatitis C. Duplex Doppler sonography and liver biopsy were performed on same occasion. Mean Ishak fibrosis score of patients with tri-, bi-, and monophasic flow patterns was 2.2±1.2, 3.1±0.7 and 4.8±0.7, respectively. Note that difference between the three flow patterns in correlation with the Ishak fibrosis score was significant (P<0.001).
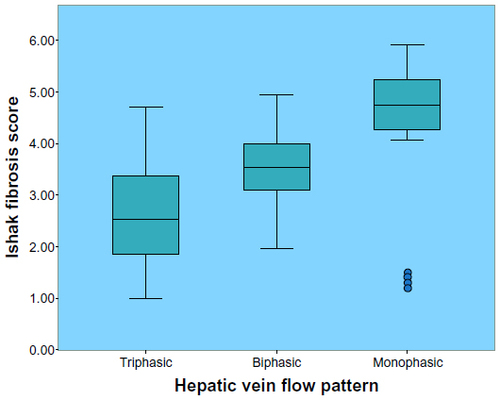
Figure 6 Linear regression analysis illustrates the relationship between hepatic veins flow pattern and Ishak fibrosis score among patients with HCV infection. (r=0.863, r2=0.745±1.703, P<0.001).
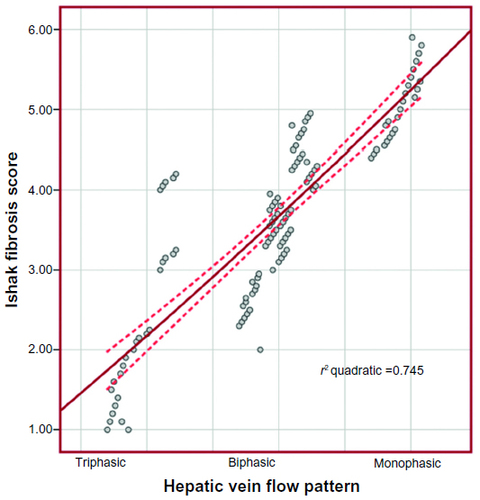
Figure 7 Box and whisker plot diagram shows hepatic vein flow pattern in relation to intrahepatic fat deposition (hepatic steatosis) in 118 patients with chronic hepatitis C. Duplex Doppler sonography and liver biopsy were performed on same occasion. Mean intrahepatic fat deposition of patients with tri-, bi-, and monophasic flow patterns was 0.4±0.5, 1.3±0.7 and 1.3±0.9, respectively. Note that difference between the three flow patterns in correlation with the intrahepatic fat deposition was significant (P<0.001).
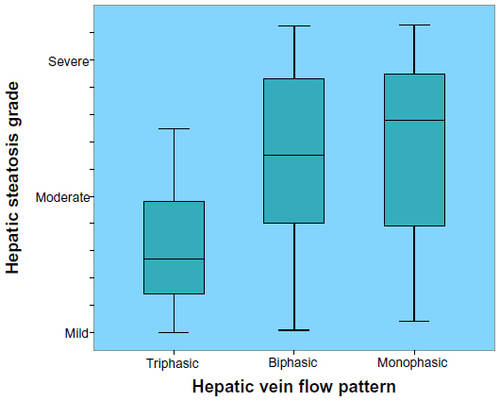
Figure 8 Linear regression analysis illustrates the relationship between hepatic veins flow pattern and intrahepatic fat deposition (hepatic steatosis) among patients with HCV infection (r=0.649, r2=0.469±0.784, P<0.001).
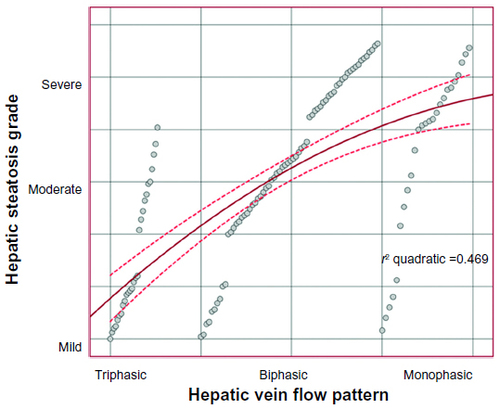
Table 4 Estimated factors for correlation with hepatic vein changes
Table 5 Diameter and blood flow of portal vein
Table 6 Estimated factors for correlation with portal vein modulation