Figures & data
Figure 1 Diagrammatic portrayal of the flow from the isthmus to the descending aorta in coarctation of the aorta with ductus open (A) and closed (B). When the ductus is open, the posterior shelf of aorta is bypassed and symptoms of obstruction are relieved. Adapted with permission from Rao PS, Solymar L. Transductal balloon angioplasty for coarctation of the aorta in the neonate: Preliminary observations. Am Heart J. 1988;116(6, Part 1):1558–1563.Citation70 doi: 10.1016/0002-8703(88)90,743–0.
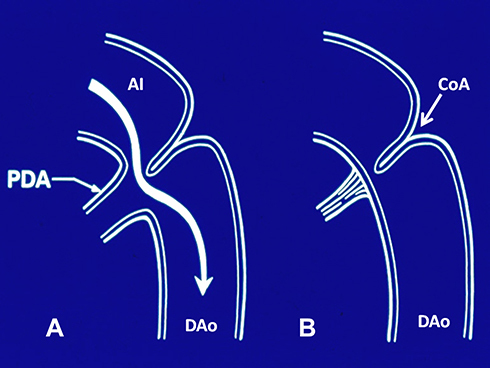
Figure 2 Selected cine angiographic frames in 20° left anterior oblique view showing a balloon dilatation catheter across the aortic coarctation with waisting (arrow) of the balloon (A) during the early phases of balloon inflation which was abolished (B) on further inflation of the balloon. Reproduced from Doshi AR, Rao PS. Coarctation of aorta-management options and decision making. Pediatr Therapeut. 2012;S5:006.Citation47
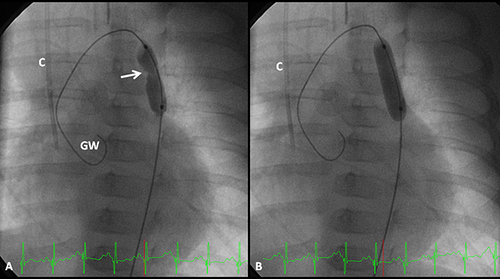
Figure 3 Selected cine frames from aortic cine angiograms in 20° left anterior oblique projection demonstrating narrowed coarcted aortic segment (arrow) before balloon angioplasty (A) which increased after balloon angioplasty (B). Moderate hypoplasia of distal transverse aortic arch and isthmus is also present. Modified from Rao PS. Role of interventional cardiology in neonates: Part II – Balloon angioplasty/valvuloplasty. Congenital Cardiol Today. 2008;6(1):1–14.Citation71
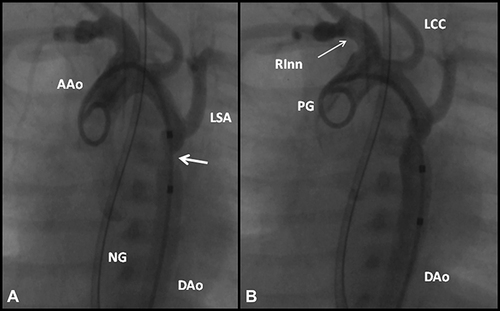
Figure 4 Actuarial event-free survival curves of neonates (<30 days), infants (1 to 12 months) and children (1 to 15 years) who had undergone balloon angioplasty of aortic coarctation are drawn. The event-free survival rates are better for children group than for the neonatal and infant groups (p < 0.001). Modified from Rao PS, Galal O, Smith PA, Wilson AD. Five-to-nine-year follow-up results of balloon angioplasty of native aortic coarctation in infants and children. J Am Coll Cardiol. 1996;27:462–470.Citation39 doi: 10.1016/0735-1097(95)00479–3.
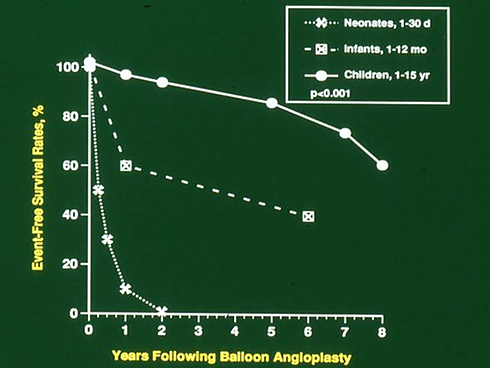
Figure 5 Bar graph showing reduction (p < 0.001) of peak-to-peak systolic pressure gradients (in mmHg) across the aortic coarctation after balloon angioplasty. The fall in the gradients was seen for the entire group (left panel) and for all the three subgroups, namely trans-umbilical arterial (UA), trans-femoral arterial (FA) and trans-femoral venous anterograde (FVA). Mean + standard deviation (SD) are shown. N represents number of subjects in each group. Modified from Rao PS, Jureidini SB, Balfour IC, Singh GK, Chen SC. Severe aortic coarctation in infants less than 3 months: Successful palliation by balloon angioplasty. J Intervent Cardiol. 2003;15(6):202–208.Citation34
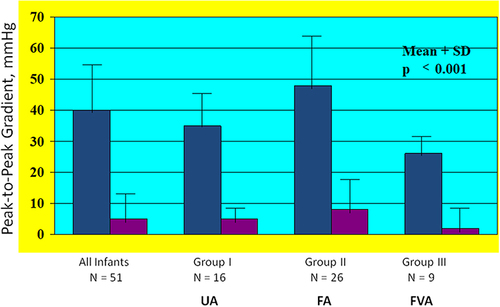
Figure 6 Selected aortic (Ao) and left ventricular (LV) cine-angiographic frames of a one-month-old baby prior to (A), immediately after (B) and 1 year following (C) balloon angioplasty are shown. The coarcted aortic segment (arrowhead) shown in “A” improved remarkably after angioplasty (B) which continues to be wide open at follow-up (C). Reproduced from Rao PS. Coarctation of the aorta. In: Secondary Forms of Hypertension, Ram CVS (Ed), Seminars in Nephrology, Kurtzman NA (Ed), (W)B. Saunders, Philadelphia, PA. Seminars in Nephrology. 1995;15(2):81–105.Citation1
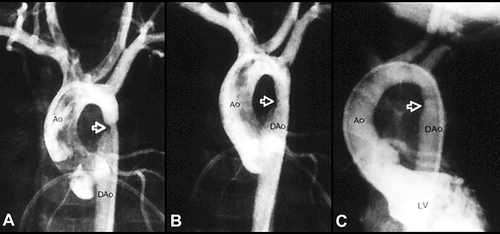
Figure 7 Bar graph demonstrating recoarctation rates during follow-up after balloon angioplasty of native coarctation in infants. The rate of recurrence is not related (p > 0.05) to the route through which balloon angioplasty was performed (left panel). However, when the patients were divided into neonates (≤ 30 days) and infants between 31 and 90 days, the rate of recurrence was significantly higher (p <0.001) in neonates than in infants (right panel). Number of subjects with recurrence/number of subjects in that particular group is shown on the top of each bar. The data indicate that age at angioplasty plays a major role in recoarctation and not the route of balloon angioplasty. Modified from Rao PS, Jureidini SB, Balfour IC, Singh GK, Chen SC. Severe aortic coarctation in infants less than 3 months: Successful palliation by balloon angioplasty. J Intervent Cardiol. 2003;15(6):202–208.Citation34
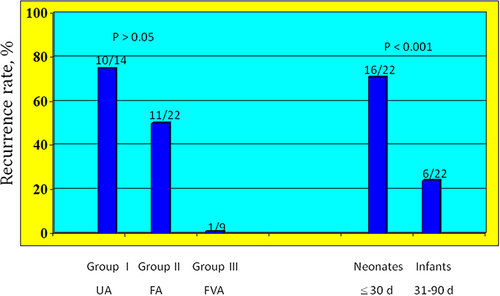
Figure 8 Bar graph shows comparison of pressure gradient reduction immediately after surgical and balloon therapy. Note significant reduction in peak-to-peak pressure gradient in both the surgical (p < 0.005) and balloon (p < 0.001) groups. This fall in pressure gradients in both groups is not significantly different (p = 0.28) form each other. Mean + standard error of mean (SEM) are shown. PRE, prior to; POST, following. Modified from Rao PS, Chopra PS, Koscik R, Smith PA, Wilson AD. Surgical versus balloon therapy for aortic coarctation in infants ≤3 months old. J Am Coll Cardiol. 1994;23(6):1479–1483.Citation42 doi: 10.1016/0735-1097(94)90395–6.
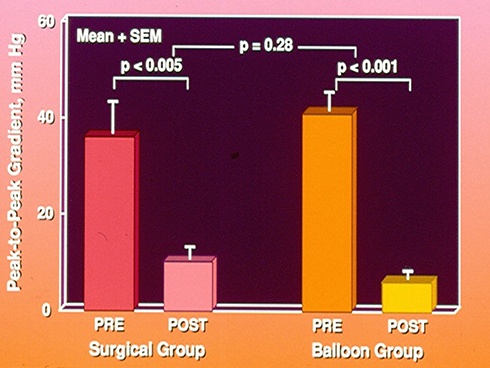
Figure 9 Bar graph shows comparison of residual pressure gradients at follow-up (left panel) after surgical (SURG) and balloon (BALL) therapy and of the results of repeat balloon angioplasty (middle and right panels, respectively). Note similar (p > 0.1) residual gradients at follow-up (left panel). Also, note that there is a significant (p < 0.01) fall in pressure gradients in both groups (middle and right panels) after repeat balloon angioplasty at follow-up (FU). Mean + standard error of mean (SEM) are shown. Modified from Rao PS, Chopra PS, Koscik R, Smith PA, Wilson AD. Surgical versus balloon therapy for aortic coarctation in infants ≤3 months old.J Am Coll Cardiol. 1994;23:1479–1483.Citation42 doi: 10.1016/0735-1097(94)90395–6.
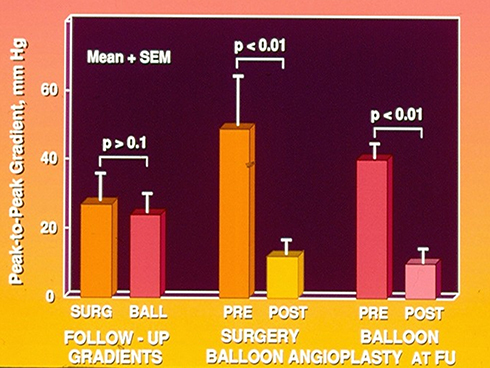
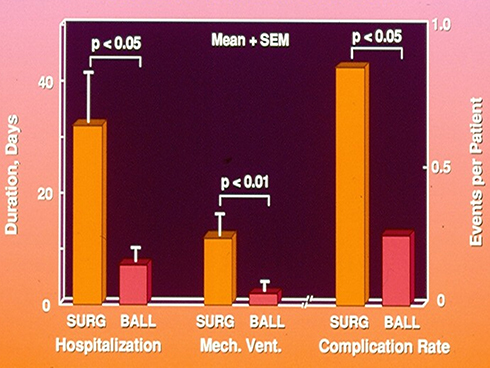
Figure 10 Bar graph showing comparison of morbidity and complication rates after surgical (SURG) and balloon (BALL) therapy. The duration of hospitalization (p < 0.05) and duration of mechanical (Mech.) ventilation (Vent.) (p < 0.01) are longer for the surgical than for the balloon group. The complication rate was higher (p < 0.05) in the surgical than in the balloon group. Mean + standard error of mean (SEM) are shown. Modified from Rao PS, Chopra PS, Koscik R, Smith PA, Wilson AD. Surgical versus balloon therapy for aortic coarctation in infants ≤3 months old. J Am Coll Cardiol. 1994;23:1479–1483.Citation42 doi: 10.1016/0735-1097(94)90395–6.