Figures & data
Figure 1 Illustration of the ductal shunt over time. Arrows indicate the direction of blood flow across the ductus. (A) The fetal duct is a physiologic right to left shunt allowing right ventricular output to supply systemic circulation. (B) In the transitional period after birth, the shunt becomes bidirectional or left to right before spontaneous closure. (C) In the case of a prolonged patent ductus, a pathologic left to right shunt contributes to pulmonary over circulation and dilation of the left atrium and the left ventricle.
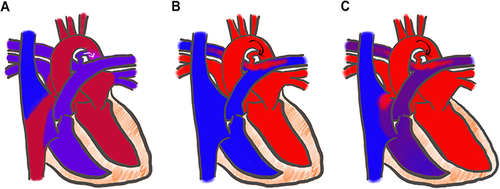
Figure 2 Number of PDA clinical trials published each year, 1976–2022. Mean publication date is 2005.Citation40
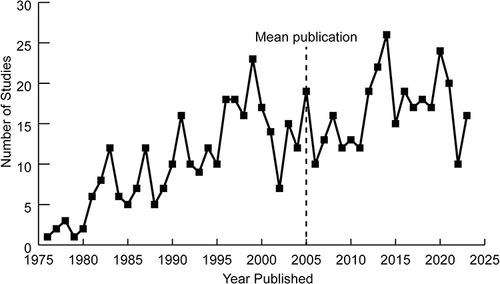
Figure 3 (A) Ductal morphology in premature low birth weight infants referred to as “Type F” PDA.Citation66 (B) It is long and tortuous, similar to the fetal ductus, giving the appearance of a hockey stick. (C) Length and width at each end can be measured.
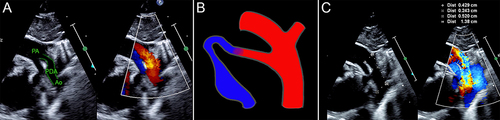
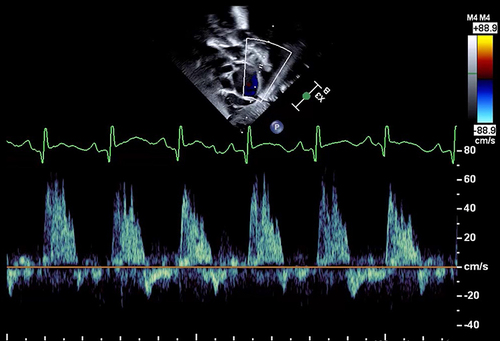
Figure 4 Doppler gradient through the PDA — Although the peak velocity is almost 3 m/s (300 cm/s), there is significant pulsatility indicated by systolic to diastolic velocity ratio >2. This suggests a significant shunt.
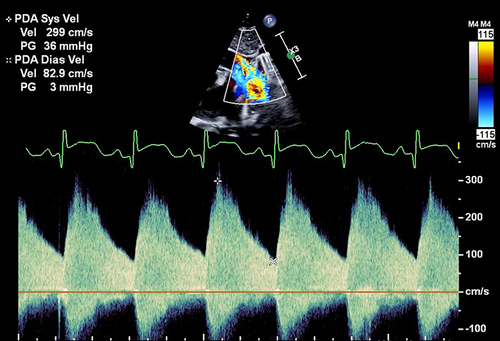
Figure 5 Signs of pulmonary over-circulation. (A) Dilated left atrium measured by M-mode. This LA:Ao >2 is severe left atrial dilation. (B) LV dilation demonstrated by a globular appearance of the heart on an apical 4-chamber view. (C) Forward flow in the LPA indicates PDA shunting during diastole.
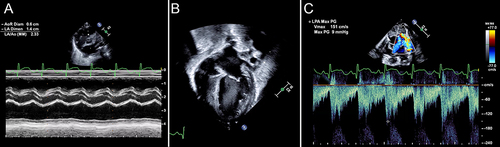
Figure 6 Potential measurement errors with LVO. Small changes in probe placement, angle of insonation, and cursor position lead to large changes in cardiac output estimations. (A) Measurement of LVOT velocity time integral. (B) Measurement of LVOT and aortic root diameter.
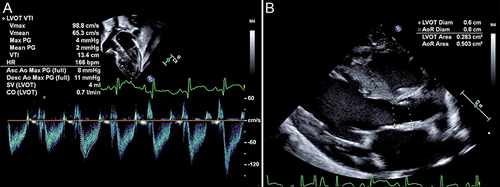
Figure 7 Pulsed-wave Doppler of the abdominal aorta demonstrates reversal of flow during diastole.