Figures & data
Figure 1 Visual representation of the relationship between the efficacy and coverage of PMTCT services.
Notes: This figure is not based on any mathematical modeling. The arrows in the figure demonstrate two dimensions through which PMTCT can be achieved. The vertical arrow signifies transitioning of the PMTCT programs from less effective to more effective PMTCT drug regimens (from sd NVP to Option A, Option B, or Option B+). The horizontal arrow indicates program coverage which can be measured by calculating the number of women completing the cascade of PMTCT services. HIV transmission rate of 2% for effective ARV/ART and 8.4% for less effective ARV (sd NVP as per HIVNET-012 trial) were assumed for making the comparison.
Abbreviations: MTCT, mother-to-child transmission of HIV; PMTCT, prevention of mother-to-child transmission; NVP, nevirapine; ARV, antiretroviral medicine; ART, antiretroviral therapy; sd, single dose.
Abbreviations: MTCT, mother-to-child transmission of HIV; PMTCT, prevention of mother-to-child transmission; NVP, nevirapine; ARV, antiretroviral medicine; ART, antiretroviral therapy; sd, single dose.
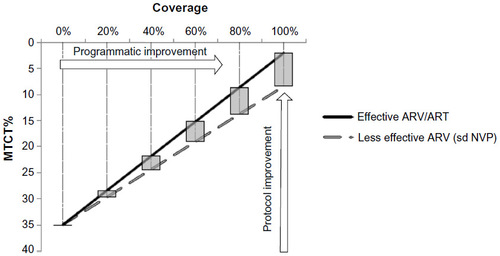
Table 1 Comparison of current PMTCT guidelines
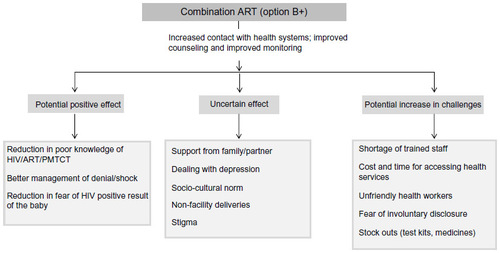
Figure 2 Possible effect of combination antiretroviral therapy (cART) on barriers to accessing continuing care due to increased number of visits to the counselor and improved monitoring.
Abbreviation: PMTCT, prevention of mother-to-child transmission.