Figures & data
Figure 1 The NGF representative slide-staining (×400) scores (0–3) (A) and the corresponding intensity staining scores (B) at the bronchiole level.
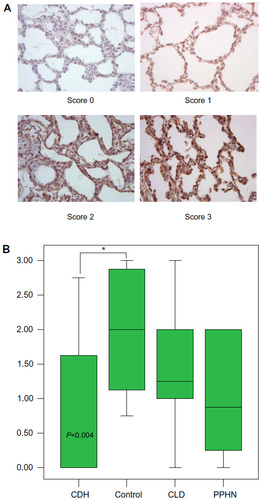
Abbreviations: CDH, congenital diaphragmatic hernia; CI, confidence interval; CLD, chronic lung disease; IQR, interquartile range; M, median; NGF, nerve growth factor; PPHN, pulmonary hypertension; R, range.
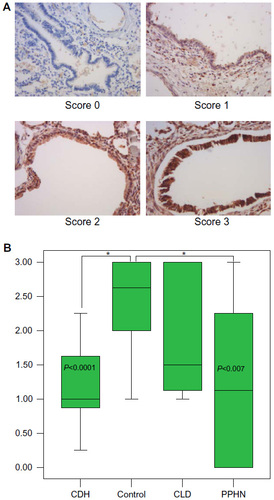
Figure 2 The NGF representative slide-staining (×400) scores (0–3) (A) and the corresponding intensity staining scores (B) at the parenchymal level.
Abbreviations: CDH, congenital diaphragmatic hernia; CI, confidence interval; CLD, chronic lung disease; IQR, interquartile range; M, median; NGF, nerve growth factor; PPHN, pulmonary hypertension; R, range.
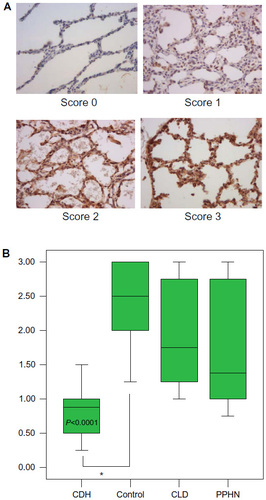
Figure 3 The NT-3 representative slide-staining (×400) scores (0–3) (A) and the corresponding intensity staining scores (B) at the bronchiole level.
Abbreviations: CDH, congenital diaphragmatic hernia; CI, confidence interval; CLD, chronic lung disease; IQR, interquartile range; M, median; NT-3, neurotrophin 3; PPHN, pulmonary hypertension; R, range.
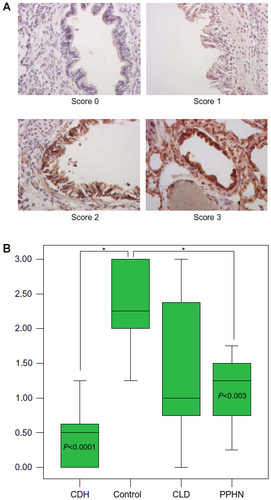
Figure 4 The NT-3 representative slide-staining (×400) scores (0–3) (A) and the corresponding intensity staining scores (B) at the parenchymal level. The control group NT-3 staining intensity had scores R 1.25–3.00, IQR 2.00–2.50, M 2.1, and the CDH group R 0.00–1.00, IQR 0.50–1.00, M 0.75. The CDH group score is significantly lower versus control, P<0.0001, CI 0.90–2.10. In this staining, CLD group score was significantly decreased relative to control. However, there was a wide range of scoring in this group: R 0.00–2.75, IQR 0.75–2.25, M 1.00, P<0.009, CI 0.20–1.50. The PPHN group score is not statistically decreased. *Shows statistical significance as indicated.
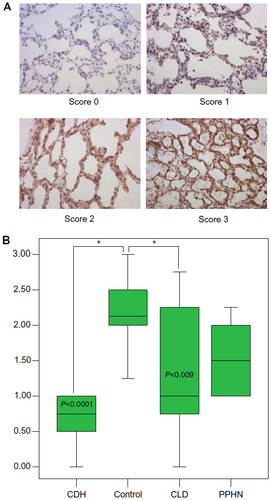
Figure 5 The BDNF representative slide staining (×400) scores (0–3) (A) and the corresponding intensity staining scores (B) at the bronchiole level. The control group had intensity scoring R 1.00–3.00, IQR 1.75–3.00, M 2.25, and the CDH group R 0.00–2.00, IQR 0.25–2.00, M 1.00; CDH group has significantly lower scores, P<0.001, CI 0.40–1.90. Scores for CLD and PPHN groups were not significantly different versus control group. *Shows statistical significance as indicated.
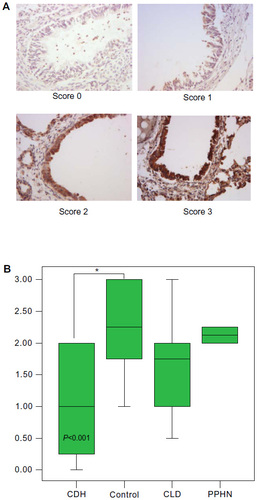
Figure 6 The BDNF representative slide staining (×400) score (0–3) (A) and the corresponding intensity staining scores (B) at the parenchymal level. The control group had score R 0.75–3.00, IQR 1.20–2.90, M 2.00. Relative to control, the CDH group had significantly lower scores R 0.00–2.75, IQR 0.00–1.60, M 0.00; P<0.004, CI 0.30–2.00. The CLD and PPHN groups had a wide range of staining intensity scores that were not significantly decreased versus control. *Shows statistical significance as indicated.