Figures & data
Figure 1 Histopathology of a granulomatous lesion due to PCM. Microphotograph of methenamine silver nitrate stain (Grocott-Gomori) demonstrating the peripheral budding yeast structures of P. brasiliensis, with the aspect of a pilot’s wheel, or “Mickey Mouse” head (red arrows).
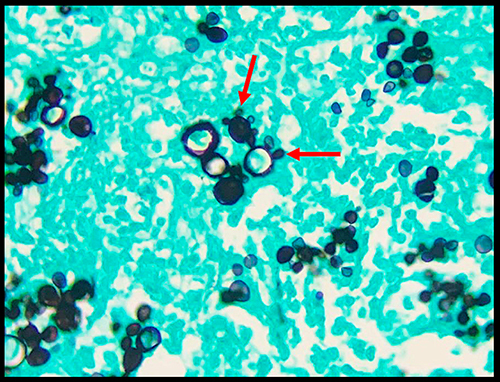
Table 1 Different Types of Neuro-PCM Presentation, Their Imaging Aspects and Main Differential Diagnoses
Figure 2 67-year-old man presented with headache and ataxia. Brain MRI revealed an expansive lesion in the left cerebellar hemisphere, with hypointense signal on T1- (arrow in (A)) and T2-weighted imaging (arrow in (B)), with peripheral gadolinium-enhancement (arrow in (C)). The lesion did not present a significant restricted diffusion, on DWI (arrow in (D)) and apparent diffusion coefficient map (arrow in (E)). The lesion also presented a reduced rCBV, on the semiquantitative CBV color map (arrow in (F)). Also note the perilesional edema, better seen on T2-weighted imaging (B), as a hyperintense perilesional signal. (G and H) Chest CT in the pulmonary window demonstrated multiple different types of lesions, such as a cavitation with an internal septa in the upper right lobe (white arrow), other cavitation in the middle lobe (blue arrow), nodules (red arrows), consolidations (yellow arrow), and reversed halo sign (green arrow). The histopathological analysis confirmed PCM in the cerebellar lesion.
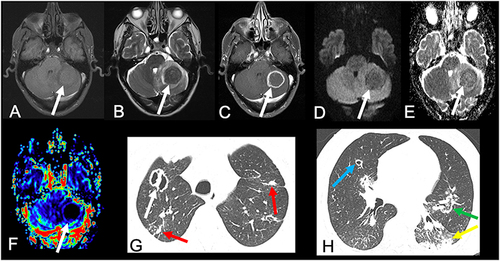
Figure 3 A 31-year-old woman presented with cough and seizures. (A) Chest radiograph revealed bilateral pulmonary consolidations, more conspicuous in the central areas (“butterfly wing” pattern). Brain MRI demonstrated a cortico-subcortical right frontal lesion, with predominantly hypointense signal on FLAIR (arrow in (B)), associated with peripheral irregular gadolinium-enhancement (arrow in (C)), and edema. Brain MRI performed 5 months after antifungal treatment showed significant reduction of the lesion and peripheral edema, on FLAIR and postcontrast T1-weighted imaging (arrows in (D and E), respectively).
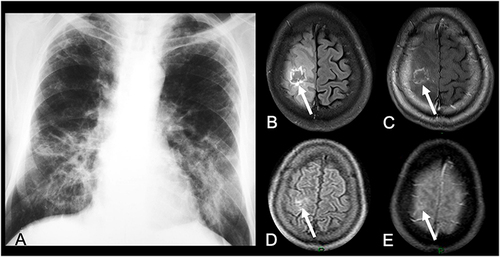
Figure 4 50-year-old man presented with headache. Brain CT revealed an hypodense expansive lesion in the right parietal lobe, with peripheral contrast-enhancement (arrow in (A)). Brain MRI demonstrated that the lesion had mild hyperintense signal on T1- (arrow in (B)) and hypointense signal on T2-weighted imaging (arrow in (C)), with peripheral gadolinium-enhancement (arrow in (D)). The lesion also had reduced rCBV, on the semiquantitative CBV color map (arrow in (E)). Furthermore, the lesion had restricted diffusion, with hyperintense signal on DWI (arrow in (F)) and hypointense signal on apparent diffusion coefficient map (arrow in (G)). Chest CT in the pulmonary window demonstrated clusters of small nodules (red arrows in (H)) and a mass (white arrow in (H)).
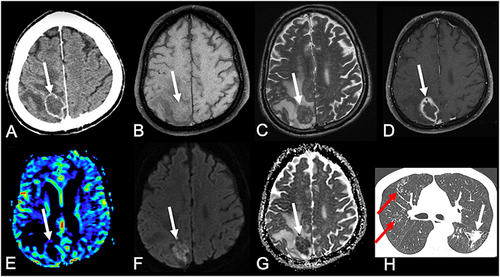
Figure 5 A 65-year-old man presented with headache and seizures. Brain MRI demonstrated a heterogeneous lesion on T2-weighted imaging in the left parietal lobe (A). (B) Proton 1H-spectroscopy of the lesion, with a short echo time (35 ms), showed a lipid peak, at 1.3 ppm, and absence of choline and N-acetylaspartate peaks. The histopathological diagnosis was PCM.
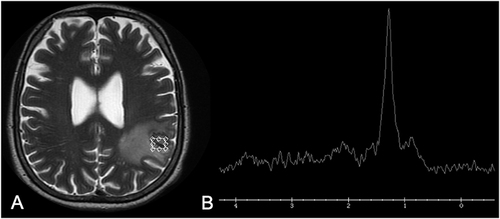
Figure 6 A 45-year-old man presented with seizures. Brain CT showed an hypodense lesion in the left frontal lobe, with peripheral edema (arrow in (A)). Brain MRI showed an expansive lesion with hyperintense signal on its central part and a peripheral hypointense signal, surrounded by edema, on T2-weighted imaging (arrow in (B)). T1-weighted imaging after intravenous gadolinium injection demonstrated a peripheral and thin enhancement in the lesion (arrow in (C)). PWI demonstrated a reduced rCBV (arrow in (D)). (E and F) Diffusion-weighted imaging and apparent diffusion coefficient map demonstrated that the lesion had a central area of diffusion restriction, suggestive of an abscess (arrows in (E and F), respectively). Chest CT demonstrated areas of reversed halo sign (white arrows in (G)) and nodules (red arrow in (G)). The histopathological analysis of the brain lesion confirmed PCM.
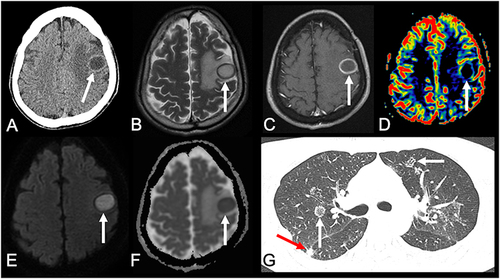
Figure 7 Note how MRI can help to differentiate a typical granuloma, from an abscess, and a high grade neoplasm. Granuloma typically has a hypointense signal on T2-weighted imaging, peripheral contrast enhancement, with no restricted diffusion and reduced rCBV. Abscess has hyperintense central signal on T2-weighted imaging, with central restricted diffusion and reduced rCBV, associated with a peripheral capsule which has hypointense signal on T2, as well as thin and regular contrast-enhancement. Lymphoma, in an immunocompetent patient, presents with hypointense signal on T2, restricted diffusion, diffuse contrast-enhancement and increased rCBV. A high-grade glioma, such as GBM, usually has heterogeneous signal on T2, with irregular contrast-enhancement and restricted diffusion, associated with increased rCBV in its solid portions. Although in general the rCBV of a lymphoma is not as high as the rCBV of a high-grade glioma, it is generally higher than the rCBV of inflammatory and infectious lesions, including granulomas and abscesses.
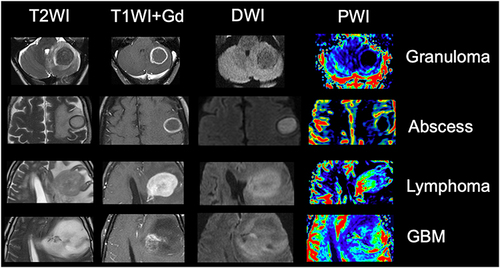
Figure 8 A 44-year-old presented with reduced level of consciousness. Brain MRI demonstrated leptomeningeal enhancement in the basal cisterns, on post-contrast T1-weighted imaging (arrows in (A)), and post-contrast FLAIR (arrows in (B)), associated with hydrocephalus (C).
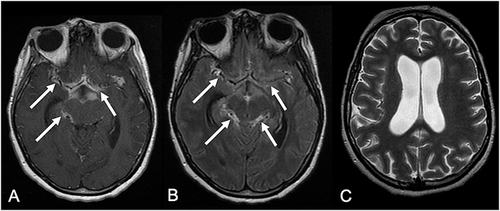
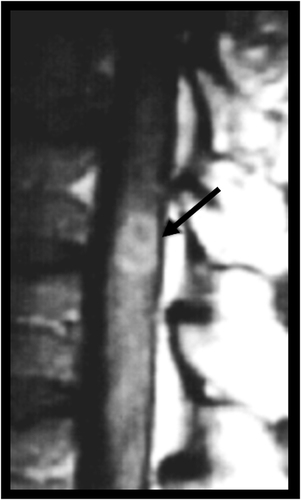
Figure 9 A 37-year-old man presented with paraplegia in the lower limbs and urinary incontinence. Thoracic spinal cord MRI demonstrated an intramedullary lesion with heterogeneous gadolinium-enhancement in the level of T12 (arrow). The patient underwent surgery, and the final diagnosis was PCM.