Figures & data
Table 1 Proportions of total collagen in control and urethral stricture groups by observation time
Figure 1 MMP1 levels in the urethral stricture group were lower than the control group on days 21 and 28.
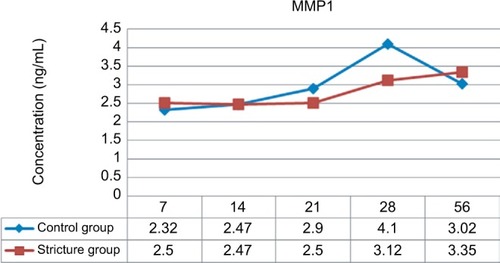
Table 2 MMP1 levels in urethra stricture and control groups by observation time
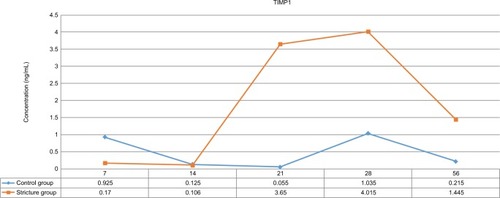
Table 3 TIMP1 levels in urethral stricture and control groups by observation time
Figure 2 TIMP1 levels were higher in the urethral stricture group than the control group on days 21, 28, and 56.