
Figures & data
Table 1 Baseline Demographic and Clinicopathological Characteristics by Prostate Statin Use Status
Figure 1 Biochemical recurrence based on statin use.
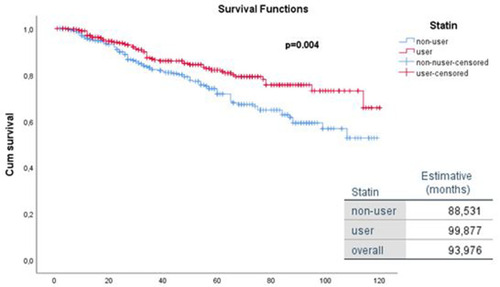
Figure 2 Kaplan–Meier survival chart by subgroups.
Notes: (A) biochemical recurrence free survival for pT2c subgroup; (B) biochemical recurrence-free survival for ISUP ≤2; (C) biochemical recurrence free survival for ISUP ≥3.
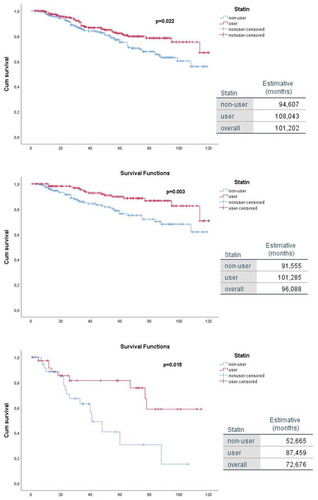
Table 2 Adjusted Hazard Ratio of Statin Use on Prostate Cancer Recurrence