Figures & data
Table 1 Clinical Characteristics of Patients
Figure 1 PCA3 and AMACR scores in groups of patients with BPH, non-csPCa and csPCa. Box whiskers correspond to 5th and 95th percentile outliers are not shown. (A) PCA3 score, prebiopsy cohort, (B) AMACR score, prebiopsy cohort, (C) PCA3 score, patients scheduled for RPE, (D) AMACR score, patients scheduled for RPE.

Figure 2 PCa and csPCa detection in the prebiopsy cohort. The number of patients is indicated by n. (A) ROC curves for PCa detection by AMACR score and PCA3 score (whole prebiopsy cohort), (B) ROC curves for csPCa detection by AMACR score and PCA3 score (whole prebiopsy cohort), (C) ROC curves for PCa detection by AMACR score, PCA3 score and PCPTRC, (D) ROC curves for csPCa detection by AMACR score, PCA3 score and PCPTRC, (E) ROC curve for PCa detection by classification model, (F) ROC curve for csPCa detection by classification model.
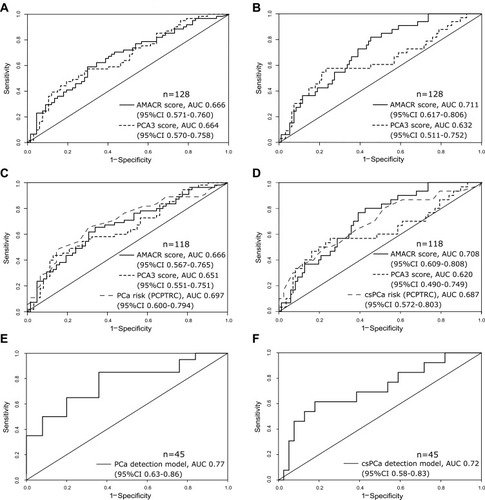
Table 2 Classification Metrics of tPSA, The PCA3 Score, The AMACR Score and Classification Models
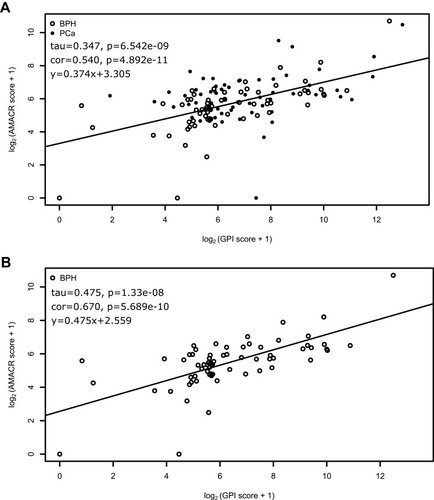
Figure 3 The AMACR and GPI score relationship. The Pearson correlation coefficient (cor), Kendall correlation coefficient (tau), p-values for them and linear regression equation are shown in the left corner of each plot. (A) The prebiopsy cohort, (B) only BPH group.