
Figures & data
Table 1 Preoperative Characteristics and Perioperative Data
Figure 1 Mean postoperative values at different points of follow-up are shown for (A) International Prostate Symptom Score (IPSS), (B) IPSS voiding symptom score, (C) IPSS storage symptom score, (D) quality of life (QOL), (E) maximal urine flow rate (Qmax, mL/s), and (F) postvoid residual urine volume (PVR, mL). *At each follow-up visit, significant differences were found from the value at baseline. †A significant difference between two groups was found in the change in each parameter from baseline to each follow-up visit.
Abbreviations: PVP, photoselective vaporization of prostate; TUEB, transurethral enucleation with a bipolar system.
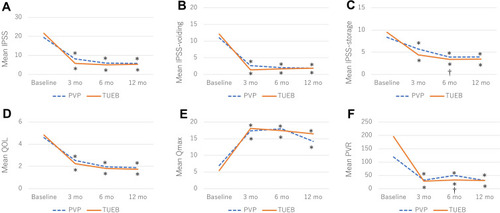
Table 2 Comparison of Postoperative Complications Between PVP and TUEB