Figures & data
Figure 1 The risk of bias summary of included studies.
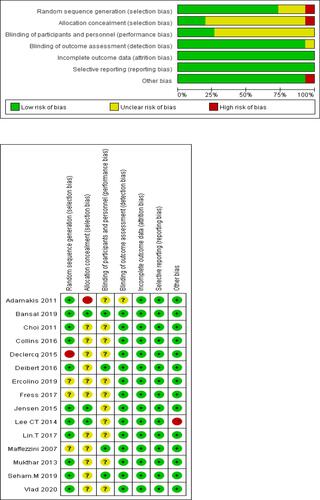
Table 1 Characteristics of Each Study
Figure 2 Flowchart of literature selection process.
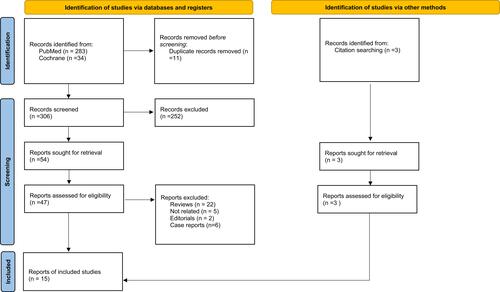
Figure 3 Forest plot displaying a random-effects meta-analysis of the effect of enhanced recovery after surgery (ERAS) on length of stay after cystectomy. Weights are from random-effects analysis.
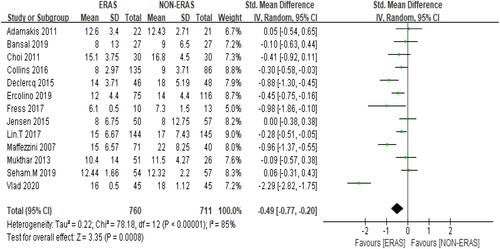
Figure 4 Forest plot displaying a fixed-effects meta-analysis of the effect of enhanced recovery after surgery (ERAS) on complication rates after cystectomy.
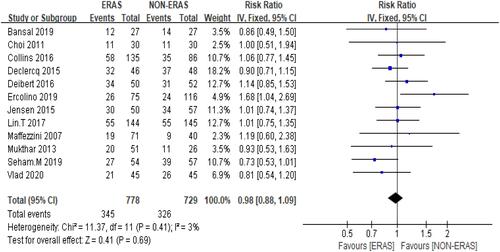
Figure 5 Forest plot displaying a random-effects meta-analysis of the effect of enhanced recovery after surgery (ERAS) on time to bowel function recovery after cystectomy. Weights are from random-effects analysis.
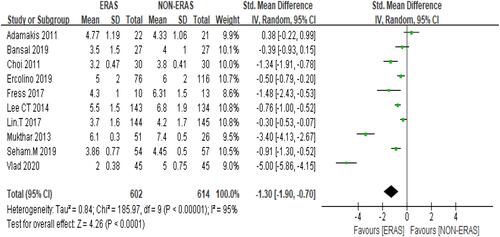
Figure 6 Forest plot displaying a fixed-effects meta-analysis of the effect of enhanced recovery after surgery (ERAS) readmission rates within 30 d after cystectomy.
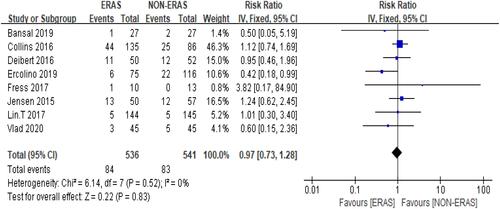
Table 3 Eggers’ Test
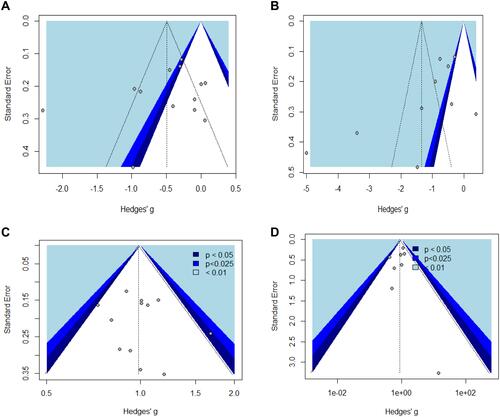
Figure 7 Contour-enhanced funnel plots for (A). Length of stay (B). bowel function (C). rate of complications (D). 30d readmission.