
Figures & data
Figure 1 Schematic diagram of the 4-node neural network model used to predict the stone type from several predictor variables including urinalysis results, crystal type, body mass index, red blood cell count, and white blood cell count.
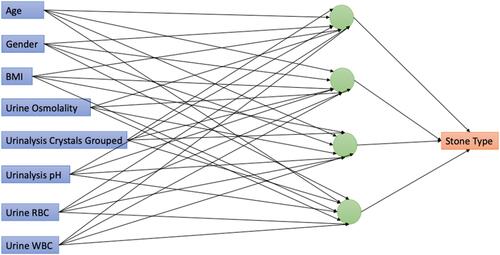
Figure 2 Typical output from a neural network model, model statistics, including R-squared values and confusion matrices, are shown on the left side, and the equivalent summary for the validation tests are shown on the right side.
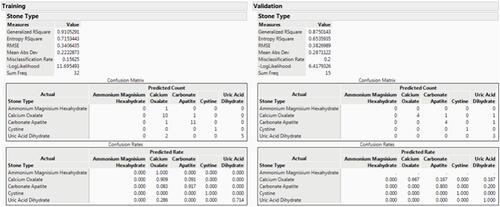
Figure 3 Receiver-operating characteristic curves for training (left) and validation data (right).
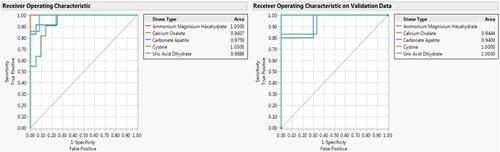
Figure 4 Snapshot of the prediction profile curves generated from the neural network model. The curves show the relative effect of the various predictor variables on the probability of generating a particular stone type.
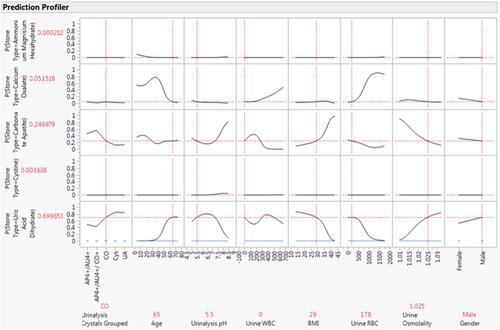
Table 1 Distribution of Different Stone Types
Table 2 Contingency Table Showing Crystal Type with Associated Stone Type
Table 3 Crystal Type and Associated Urinary pH
Table 4 Stone Type and Associated pH