
Figures & data
Table 1 Distribution of the Type of Malignancy of the Three Groups
Figure 1 Flow diagram with procedures and patient’s state.
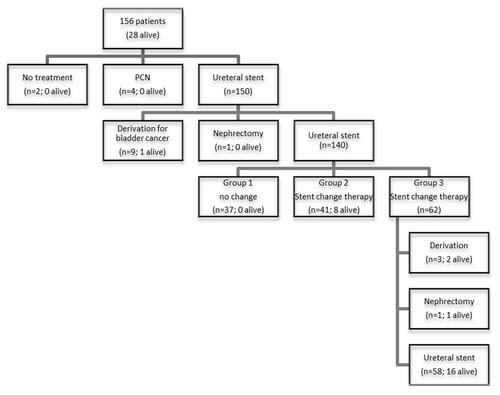
Table 2 Characteristics of the 150 Patients of the Three Groups. Ten Procedures Followed by Ileal Conduit Urinary Diversion Were Excluded
Figure 2 Kaplan–Meier analysis of overall survival after stenting in group 1 (green curve), group 2 (blue curve) and group 3 (red curve). The dotted curve indicates the decrease in the incidence of stent failure over time. The median time to the occurrence of an event (death or censored) was 2 months with [IC95 2–6] for group 1, 22 months with [IC95 17–33] for group 2, and 26 months with [IC95 20–41] for group 3.
![Figure 2 Kaplan–Meier analysis of overall survival after stenting in group 1 (green curve), group 2 (blue curve) and group 3 (red curve). The dotted curve indicates the decrease in the incidence of stent failure over time. The median time to the occurrence of an event (death or censored) was 2 months with [IC95 2–6] for group 1, 22 months with [IC95 17–33] for group 2, and 26 months with [IC95 20–41] for group 3.](/cms/asset/023a0c99-8d18-4e4c-a808-34c80f968fd3/drru_a_12180612_f0002_c.jpg)