Figures & data
Figure 1 Gleason score and T stage. Tukey box-and-whisker plot of EDTA-plasma CCL2 levels (pg/mL) plotted against (A) Gleason score. (B) cT stage. Table shows patient PSA and EDTA-plasma CCL2 levels (pg/mL) levels ability to predict Gleason score. For comparison of multiple group means Kruskal–Wallis’ nonparametric test was used, p-values < 0.05 were considered significant (*).
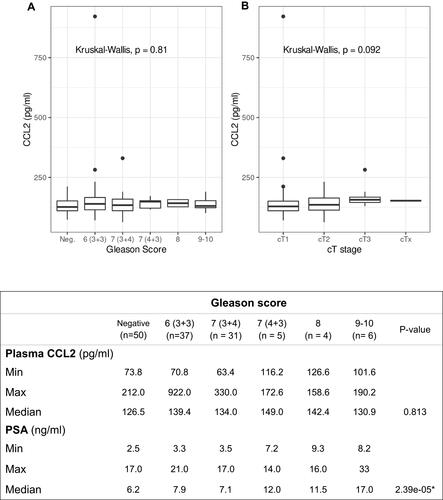
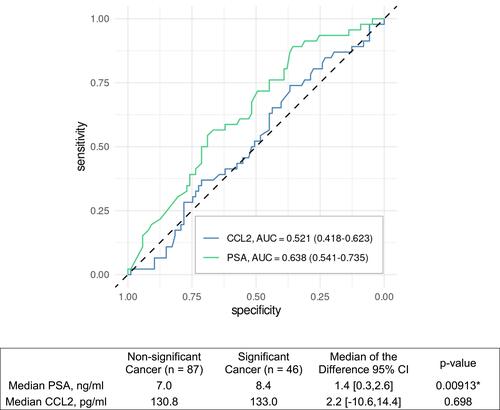
Figure 2 CCL2 & PSA levels ROC and predictive power. PSA and CCL2 receiver operating characteristic curve for significant cancer versus Gleason Score 6 (3+3) or negative biopsies and ability to predict significant cancer. Wilcoxon nonparametric test was used for two-group comparison, p-values < 0.05 were considered significant (*). Confidence bands for area under the curve (AUC) for receiver operating characteristic (ROC) curves were compared using DeLongs’s nonparametric approach.