Figures & data
Table 1 Biomarker Positivity Cutoffs
Table 2 Demographics of the Study Cohort
Figure 1 Organism detection prevalence.
Note: Organisms or organism groups are arranged on the y-axis in descending order of detection prevalence. Bar length along the x-axis represents the percent of M-PCR-positive specimens (microbial density ≥ 10,000 cells/mL for bacteria/bacterial groups or > 0 cells/mL for yeasts). The number (n) of detections are shown with labels at the end of each bar.
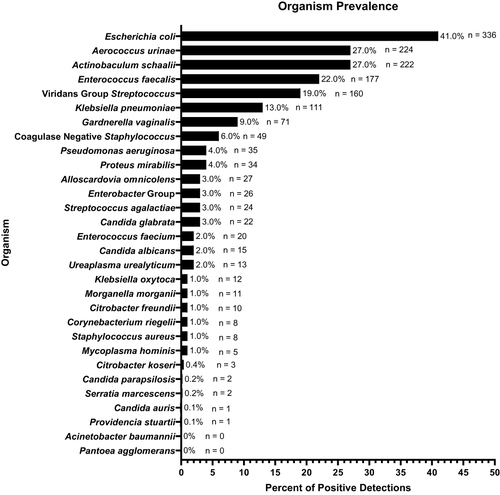
Table 3 Biomarker Positivity in Groups of Five Organisms by Prevalence
Table 4 Biomarker Positivity in M-PCR Positive versus Negative Cases
Table 5 Biomarker Positivity in M-PCR Positive Cases Grouped by Organism and Infection Characteristics
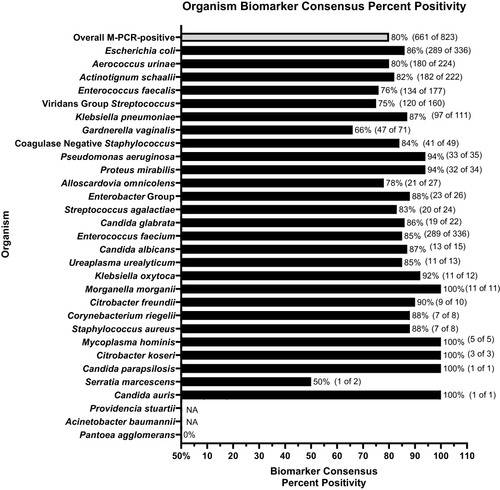
Figure 2 Biomarker consensus percent positivity by microbial identification.
Notes: Organisms or organism groups are listed on the y-axis in descending order of detection prevalence. Bar length along the x-axis represents the percentage of positive specimens (microbial density ≥ 10,000 cells/mL for bacteria/bacterial groups or > 0 cells/mL for yeasts) that are also positive for biomarker consensus. Labels at the end of each bar show the associated biomarker consensus percentage and the number of biomarker consensus positive specimens out of the total number of specimens positive for that organism (in parenthesis).